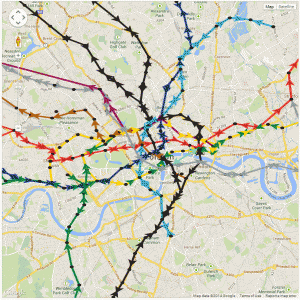
Following on from my previous posts on AgentScript and Google Maps, I’ve fixed the performance problem when zooming in and built a model of the London Underground to play with:
An AgentScript model of the London Underground using data for 27 January 2014 at 15:42:00
I’m not going to include the modified code here as it’s grown a bit too long for a blog post, but the aim is to tidy it up and publish it on GitHub as something which other people can use as a library. The zooming in problem with my previous examples occurs because the Canvas used by AgentScript doubles in size each time you zoom in. Google Maps works by using tiles of a fixed size, but AgentScript isn’t designed to use tiles as it uses the vector based drawing methods of the Canvas object. My original idea for fixing the zooming in problem was to include a clip rect on all the Canvas elements which AgentScript adds. This doesn’t work and the only solution seems to be to limit the size of the Canvas to just what is visible on the screen. The new code contains a lot of transformation calculations to change the size of the Canvas as you pan and zoom. When the map is panned you can see the new visible area being drawn when the drag is released (see following YouTube video).
The only drawback of this is that the drawing Canvas for the turtle’s pen can’t be preserved between drag and zoom as it’s being clipped to the visible viewport. You can also see that the station circles aren’t circles as AgentScript is drawing in a Cartesian system which I’m fitting to a Mercator box. These are problems I hope to overcome in a future version.
Now that I’ve got a model of the London Underground in a box, I can start experimenting with it. The code to run the model is as follows:
[code language=”js”]
#######################################################
#AgentScript
#######################################################
u = ABM.util # shortcut for ABM.util
class MyModel extends ABM.Model
#this is a kludge to get the bounds to the model – really need a class to encapsulate this
constructor: (div, size, minX, maxX, minY, maxY, isTorus, hasNeighbors, bounds) ->
@bounds_=bounds
super(div,size,minX,maxX,minY,maxY,isTorus,hasNeighbors)
setup: -> # called by Model constructor
#console.log(@)
#console.log(@gis(52,48))
#@anim.setRate(10) #one frame a second (default is 30)
@lineColours =
B: [0xb0,0x61,0x10]
C: [0xef,0x2e,0x24]
D: [0x00,0x86,0x40]
H: [0xff,0xd2,0x03] #this is yellow!
J: [0x95,0x9c,0xa2]
M: [0x98,0x00,0x5d]
N: [0x23,0x1f,0x20]
P: [0x1c,0x3f,0x95]
V: [0x00,0x9d,0xdc]
W: [0x86,0xce,0xbc]
#lineY colour?
#create nodes and drivers agents (drivers move between nodes)
@agentBreeds "nodes drivers"
@nodes.setDefault "shape", "circle"
@nodes.setDefault "size", .2
@nodes.setDefault "color", [0,0,0]
@drivers.setDefault "size", 0.5
@links.setDefault "thickness", 0.5
#optimisations
@refreshPatches = false
@refreshLinks = false
# @patches.usePixels()
# @patches.cacheAgentsHere()
@agents.setUseSprites() # 24 -> 36
# @agents.cacheLinks()
# globals
#@numNodes = 30
@numDrivers = 10
#load tube station data from csv file
xhr = u.xhrLoadFile(‘data/station-codes.csv’,’GET’,’text’,(csv)=>
#there are no quotes in my station list csv file, so parse it the easy way
#jQuery csv or http://code.google.com/p/csv-to-array/ might be better alternatives
lines = csv.split(/\r\n|\r|\n/g)
for line in lines
if line[0]!=’#’
data = line.split(‘,’)
stn = data[0]
lon = data[3]
lat = data[4]
lon=parseFloat(lon)
lat=parseFloat(lat)
if !(isNaN(lat) and isNaN(lon))
pxy = @gisLatLonToPatchXY lat, lon
#ABM.Agent.hatch 1, @nodes
# @x=pxy.patchx
# @y=pxy.patchy
#@nodes.hatch 1
@patches.patchXY(Math.round(pxy.patchx),Math.round(pxy.patchy)).sprout 1, @nodes, (a) =>
a.x=pxy.patchx
a.y=pxy.patchy
a.name=stn
)
#load network graph from json file
xhr2 = u.xhrLoadFile(‘data/tube-network.json’,’GET’,’json’,(json)=>
#it looks like this returns a json object directly
#test = JSON.parse json #newer browers support this, otherwise use var objJSON = eval("(function(){return " + strJSON + ";})()");
#wait for both files (stations+network) to be loaded before making the links between station nodes
u.waitOnFiles(()=>
#console.log("xhr2 wait",@nodes.length)
#json file has [‘B’], [‘C’], [‘D’] etc array at top level for all lines
#each of these contain { ‘0’: zero direction array, ‘1’: one direction array }
#where each array is a list of OD links as follows: { d: "STK", o: "BRX", r: 120 }
#d=destination, o=origin and r=runtime in seconds
for linecode in [ ‘B’, ‘C’, ‘D’, ‘H’, ‘J’, ‘M’, ‘N’, ‘P’, ‘V’, ‘W’ ]
#console.log("line data",json[linecode][‘0’])
for dir in [0, 1]
for v in json[linecode][dir]
agent_o = @nodes.with("o.name==’"+v.o+"’")
agent_d = @nodes.with("o.name==’"+v.d+"’")
@links.create agent_o[0], agent_d[0], (lnk) =>
lnk.lineCode = linecode
lnk.direction = dir
lnk.runlink = v.r
lnk.color = @lineColours[linecode]
#now add a pre-created velocity for this link based on distance and runlink seconds
dx=lnk.end2.x-lnk.end1.x
dy=lnk.end2.y-lnk.end1.y
dist=Math.sqrt(dx*dx+dy*dy)
lnk.velocity = dist/lnk.runlink
#NEW CODE TO LOAD POSITIONS FROM CSV
@loadPositions()
)
)
null # avoid returning "for" results above
loadPositions: ->
#get current positions of tubes from the web service
xhr = u.xhrLoadFile(‘data/trackernet_20140127_154200.csv’,’GET’,’text’,(csv)=>
#set data time here – needed for interpolation
lines = csv.split(/\r\n|\r|\n/g)
for i in [1..lines.length-1]
data = lines[i].split(‘,’)
if data.length==15
#line,trip,set,lat,lon,east,north,timetostation,location,stationcode,stationname,platform,platformdirectioncode,destination,destinationcode
for j in [0..data.length-1]
data[j]=data[j].replace(/\"/g,”) #remove quotes from all columns
lineCode = data[0]
tripcode=data[1]
setcode=data[2]
stationcode = data[9] #.replace(/\"/g,”) #remove quotes
dir = parseInt(data[12])
agent_d = @nodes.with("o.name==’"+stationcode+"’") #destination node station
#find a link with the correct linecode that connects o to d
if (agent_d.length>0)
for l in agent_d[0].myInLinks()
#console.log("l: ",l)
if l.lineCode==lineCode and l.direction==dir
#OK, so l is the link that this tube is on and we just have to position between end1 and end2
#now hatch a new agent driver from this node and place in correct location
#nominally, the link direction is end1 to end2
l.end1.hatch 1, @drivers, (a) => #hatch a driver from a node
a.name=l.lineCode+’_’+tripcode+"_"+setcode #unique name to match up to next data download
a.fromNode = l.end1
a.toNode = l.end2
a.face a.toNode
a.v = l.velocity #use pre-created velocity for this link
a.direction = l.direction
a.lineCode = l.lineCode
a.color=@lineColours[l.lineCode]
)
null
step: ->
for d in @drivers
d.face d.toNode
d.forward Math.min d.v, d.distance d.toNode
if .01 > d.distance d.toNode # or (d.distance d.toNode) < .01
d.fromNode = d.toNode
#choose new node to move towards
#d.toNode = u.oneOf d.toNode.linkNeighbors() #.oneOf()
#console.log(d)
#console.log(d.fromNode.myOutLinks())
#lnks = ABM.AgentSet.asSet(u.oneOf d.fromNode.myOutLinks())
#vlnks = lnks.with("o.line==’V’ && o.direction==1")
#if (vlnks.length>0)
# d.toNode = vlnks.oneOf()
###########################################
#pick a random one of the outlinks from this node
#NOTE: the agent’s myOutLinks code go through all links to find any with from=me i.e. it’s inefficient
#also, you can’t use "with" as it returns an array
lnks = (lnk for lnk in d.fromNode.myOutLinks() when lnk.lineCode==d.lineCode and lnk.direction==d.direction)
#console.log("LINKS: ",lnks)
if (lnks.length>0)
l = lnks[u.randomInt lnks.length]
d.toNode = l.end2
d.v = l.velocity
else
#condition when we’ve got to the end of the line and need to change direction – drop the direction constraint
lnks = (lnk for lnk in d.fromNode.myOutLinks() when lnk.lineCode==d.lineCode)
if (lnks.length>0)
l = lnks[0]
d.direction=l.direction #don’t forget to change the direction – otherwise everybody gets stuck on the last link
d.toNode = l.end2
d.v = l.velocity
else
#should never happen
console.log("ERROR: no end of line choice for driver: ",d)
#d.die ?
null # avoid returning "for" results above
[/code]
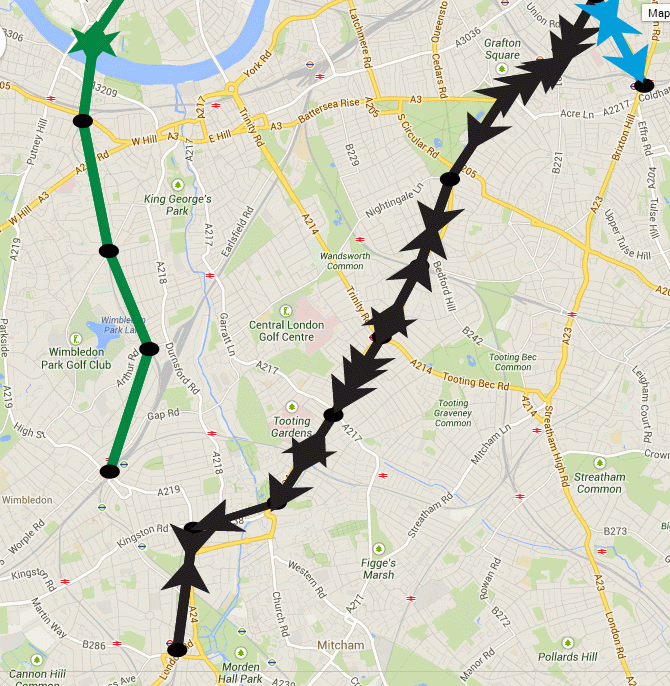
The interesting thing about this is that when you’ve been running the model for a while, you start to notice that the tubes begin to bunch up together:
Snapshot of the London Underground model showing gaps opening up and bunching of trains
Compression waves aren’t supposed to exist in the tube network, but the graphic above clearly shows how a gap has formed in the District line to Wimbledon (green), while the Northern Line to Morden (black) shows three trains travelling south together. It’s more apparent on the YouTube video as you can see how this builds up from the starting condition (27th Jan 2014 15:42), where the tubes are evenly spaced. What I suspect is happening is a function of the network and the random choices that are being made when a train gets to a decision point. The model uses a random number generator (uniform) to make the route choice, so the lines with the most complex branches (e.g. Northern) are showing this problem as a result of the random shuffling of trains. Crucially, the Victoria Line doesn’t exhibit this phenomena as it’s a single piece of straight track.
So, based on the fact that I suspect this is a fault of the model, why would it be of interest in the real tube network? If the route decisions were made correctly based on service frequency and not a highly suspect but supposed to be uniform Javascript random number generator, then you would still see a form of this effect in real life. It must happen just because you can’t guarantee when a train from a connecting branch will join behind another one. The spacings are so close that any longer than average wait at a station will cause problems behind. Line controllers limit this problem by asking trains to wait at stations to maintain the spacing. This is completely missing from the model, which has no feedback of this kind, and so we see the network diverging. The key point is that we can measure how much intervention is required to keep the network in its ideal state, which is where the archives of real life running data come into play. By looking at data from the real network it should be possible to see where these sorts of interventions are being made and compare it to our model. It’s not difficult to add wait times at stations to simulate loading in the rush hour.
Link to YouTube video: http://youtu.be/owT3PfR5CWM


