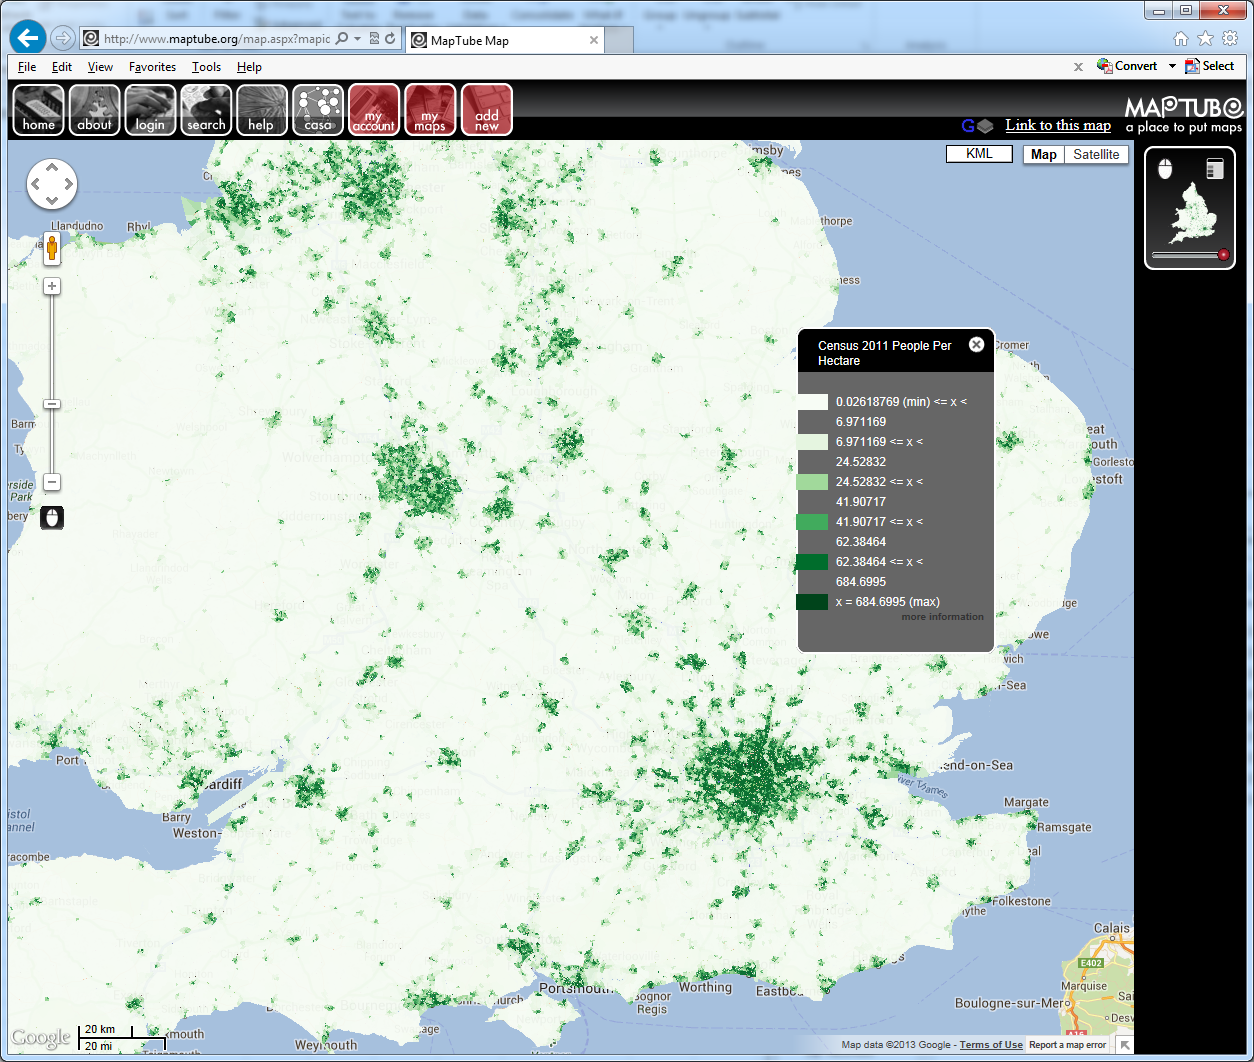
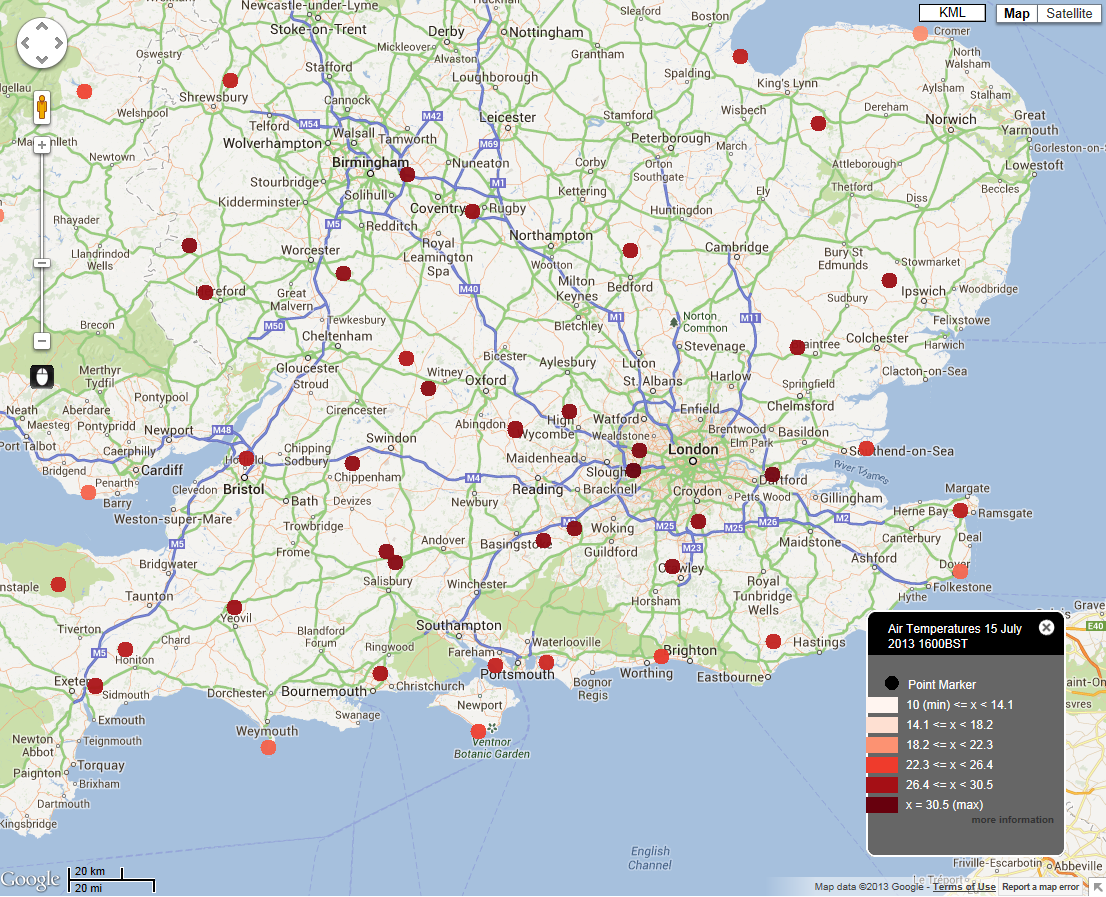
It’s been hot in London today, as you can see from the temperature data, obtained from the Met Office Datapoint site:
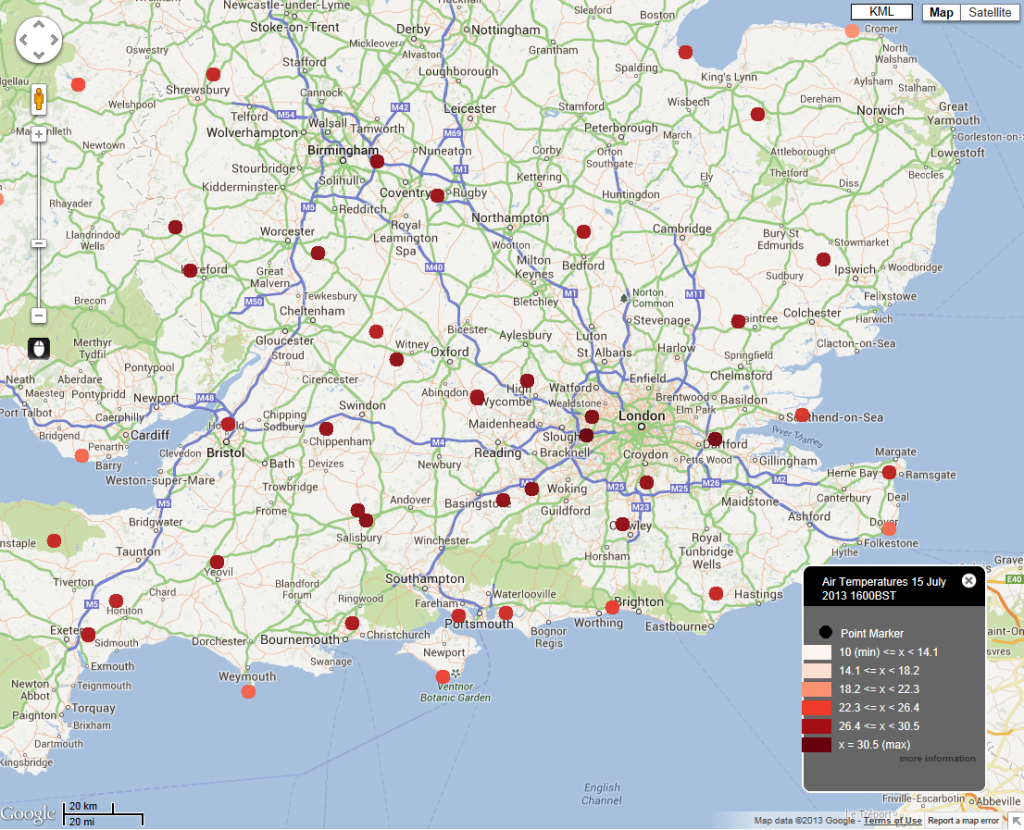
Air Temperature for 16:00 BST (local time). Full map available at: http://www.maptube.org/map.aspx?mapid=1276
What isn’t immediately apparent is that the temperature in London was around 30C from mid-morning until the evening and the sustained temperatures caused a lot of problems with the transport system. I would like to be able to see the urban heat island effect, but there are no temperature measurements inside London itself and we’re having to use Heathrow as the nearest. I hope to remedy this situation using a GTS decoder fairly soon, but for now we’re missing London City airport and London weather centre.
Going back to the transport data, the problems outside Waterloo where a rail buckled in the heat, causing the closure of 4 platforms and creating travel chaos for the evening commute were well publicised in the media. The rail data looks something like this:
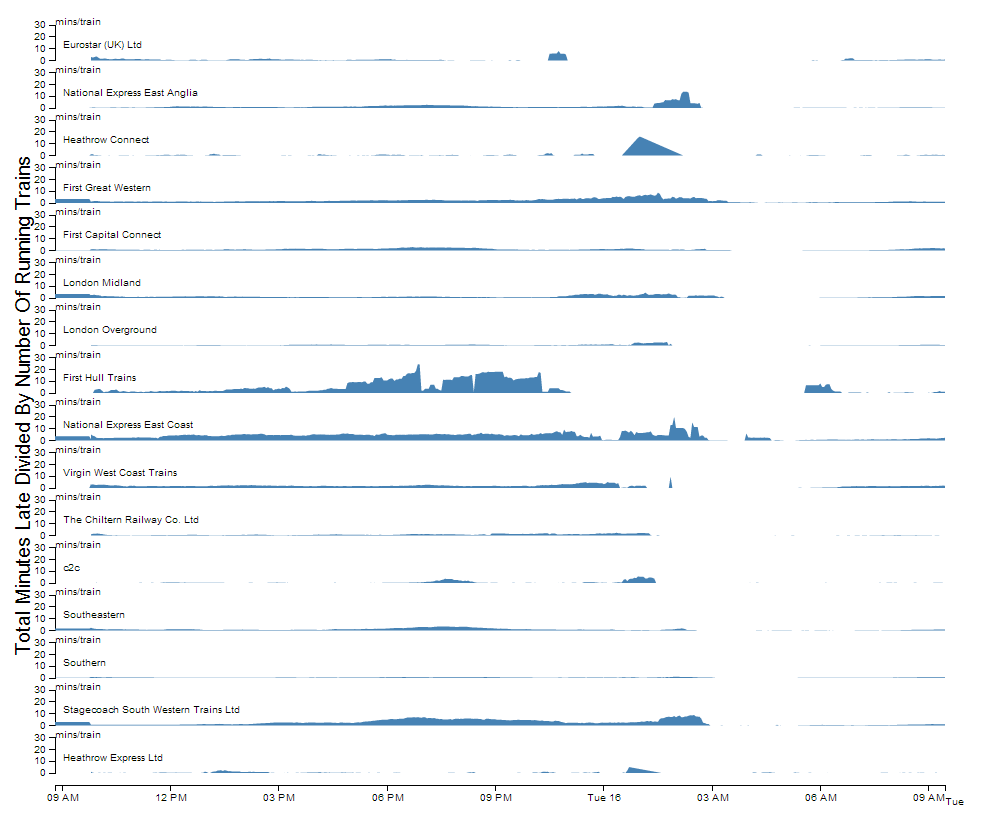
Average late minutes per train, plotted for all train operating companies for 15th (9am) to 16th (9am) July 2013.
The problems for SW Trains from 6PM onwards can clearly be seen, but, looking at the other train operating companies, this does not seem like an isolated problem. Southeastern and C2C appear to have issues round about the same time, while East Coast and First Hull Trains have on-going problems.
The key issue here is how to link data of this kind to what is actually happening in the real world, as a small change in our figure here doesn’t adequately convey the complete chaos that is caused. Timing is crucial, so we need to include expected demand on the service, along with spatial data showing where problems are located and what they are affecting. In this situation, the closure of platforms 1 to 4 caused major problems to the loop services which start and finish at Waterloo. Temperature is the root cause and, as a number of operators are affected, there must be a relationship between probability of failure and temperature which we can try and determine from our archive of running data. Unfortunately, we only have a single year of data, but there is enough quantity of data to make for an interesting investigation.
Going back to the weather data, we really need to be able to track these types of events in real time. Bringing in weather underground data might fill some of the data holes in the centre of London, if we can overcome the accuracy problems, but there are satellite instruments that we could use as well. I’ve always wanted to be able to plot the position of the jet stream on a map, using the upper air data (PILOTs and TEMPs). Hopefully, using the Met Office’s Datapoint data, weather underground and the data on the GTS feed, we should be able to integrate everything together to give us a clue as to the bigger picture.