
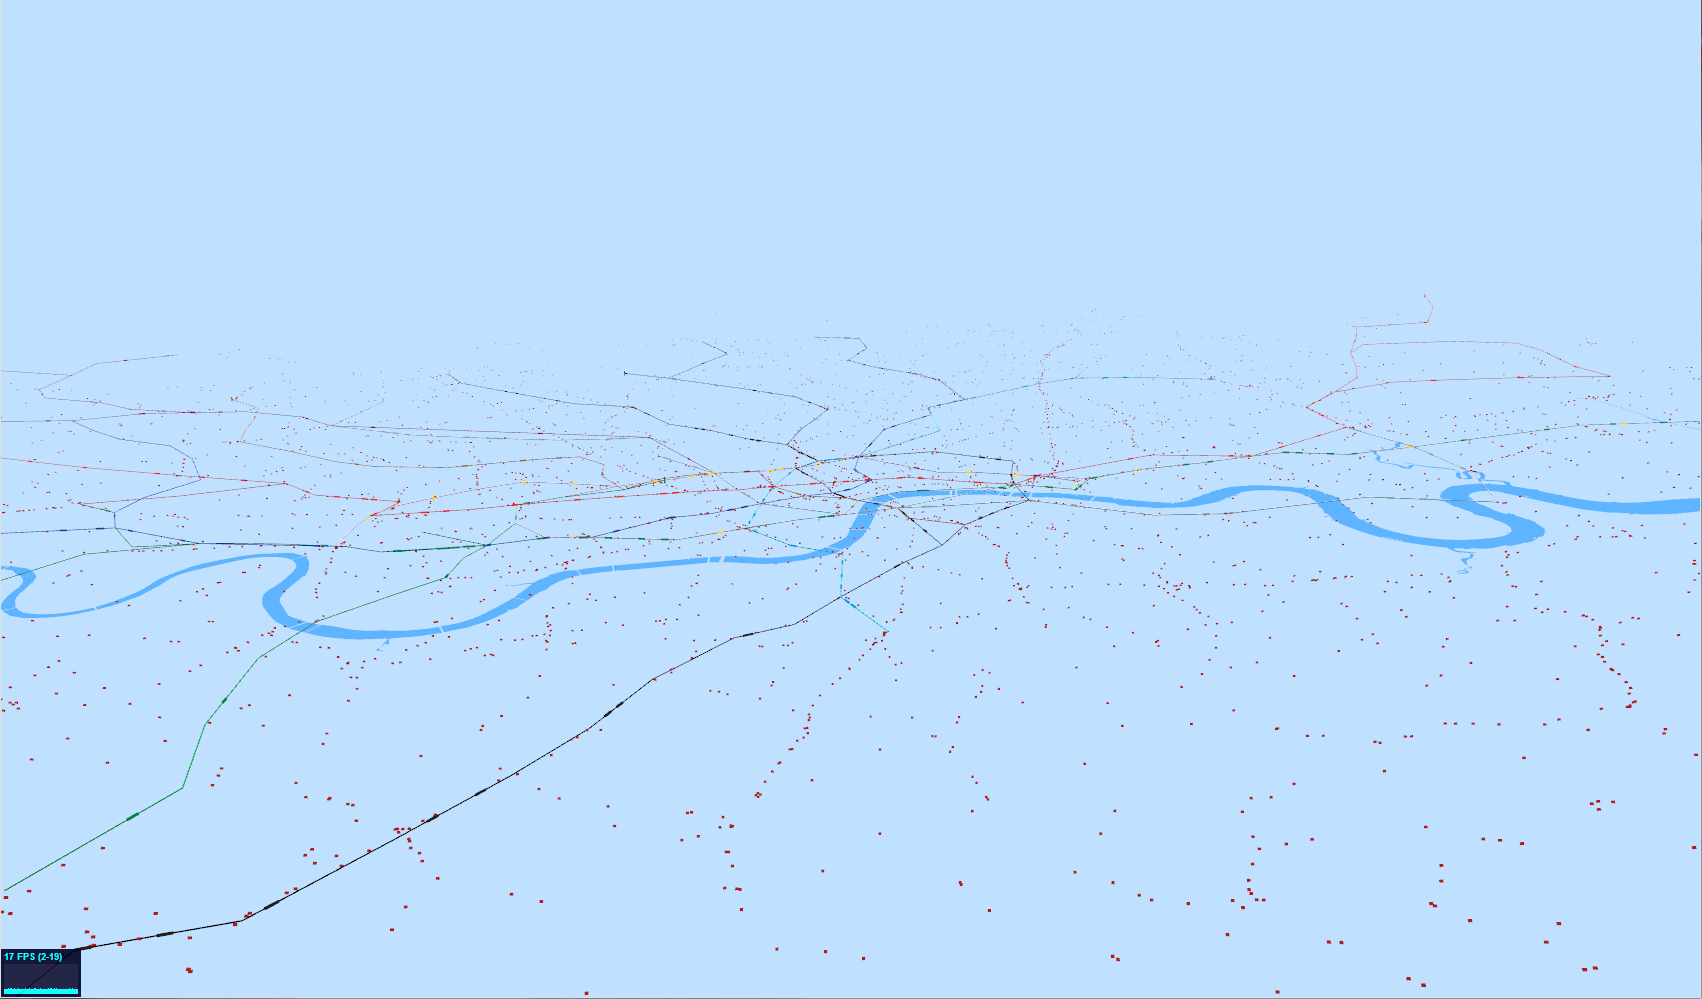
The image above shows the latest attempt at producing a real-time moving visualisation of the whole of London’s transport system. The tube lines are visible with the darker areas showing the locations of the actual tube trains. These are really too small to see at this resolution as I’ve zoomed out to show all the tiny red dots, which are the buses. Both the tubes and the buses are now animated as can be seen in the following YouTube clip:
As a rough guide to performance, there are approximately 450 tubes and 7,000 buses being animated at around 19 frames per second on an i7 with a Radeon 6900M graphics card (27 inch iMac).
The first thing that most people are going to notice is that not all the buses are actually moving. The reason for this is quite interesting as I’ve had to use different methods of animating the tube and bus agents to get the performance. The other thing that’s not quite right is that the buses move in straight lines between stops, not along the road network. This is particularly noticeable for the ones going over bridges.
The tubes are all individual “Object3D” objects in three.js and animate using a network graph of the whole tube network. This works well for the tubes as there are comparatively few of them, so, when the data says “one minute to next station” and we’ve been animating for over a minute, then we can work out what the next stop on its route is and generate a new animation record for the next station along. When there are 7,000 buses and 21,000 bus stops, though, the complete bus network is an order of magnitude more complicated than the tube. For this reason, I’m not using a network graph, but holding the bus position when it gets to the next stop on the route as I can’t calculate the next bus stop without holding the entire 21,000 vertex network in memory. While this would probably work, it seems to make more sense to push the more complicated calculations over to the server side and only hold the animation data on the WebGL client. Including the road network is also another level of complexity, so it would make a lot of sense to include this in the server side code, so the client effectively gets sent a list of waypoints to use for the animation.
Finally, I have to concede that this isn’t terribly useful as a visualisation. It’s not until delays and problems are included in the visualisation that it starts to become interesting.