After three years, this is my final day on the Talisman project as I start on the Future Cities Catapult project on October 1st. If you go back through the blog posts, all the project highlights are there, including all the builds, conferences, workshops, exhibitions and the hackathon.
Following on from my last post on running agent based models in MapTube using AgentScript, I’ve now got my “live” tube animation working:
I’ve speeded up the trains by a factor of 10 so you can see them move, but otherwise, it’s just a modification of the coffeescript code I was using before on a standalone web page. This isn’t on the production MapTube website yet, only the development tree as there are still a few problems to iron out. Also, it’s not really live as the data is loaded from an archive file stored on the same site. This highlights one of the problems with loading data dynamically. I could pull a live file straight off of the ANTS server which we use for all our live visualisations. The problem with this is that it’s a cross site request, so I’m going to need to put a JSONP endpoint into the server in addition to regular JSON and XML. The alternative would be to create a proxy on MapTube, but I’m trying to keep the code as generic as possible.
What’s happening at the moment is that the coffeescript model of the tube system is created just as though it were a normal standalone AgentScript model with no map behind it. The initialisation creates an “AgentOverlay” class which encapsulates the model and handles all the necessary interaction with the Google Map:
The “AgentOverlay” communicates with the MapTube code on the page to register the overlay which allows interaction with it. As you can see from the YouTube clip, the layers icons on the right hand side are still missing and I need to include some additional code so the model can pop up its own colour scale and other widget windows. At the moment it’s looking like it’s possible to give the code almost complete control over the information it shows, which will give me the ability to create custom maps very easily. The only issue that looks impossible to fix, though, is the separation of code between layers. There are always going to be code clashes between layers, so it’s just going to have to rely on programmers using unique namespaces for their code.
ModelTube is the name of the project to integrate agent based modelling into MapTube. Back at the end of last year I did a blog post on how to integrate AgentScript with Google Maps: http://www.geotalisman.org/2013/12/18/bugs-on-a-map/. Following on from this, I used the AgentScript agent based modelling framework, which is based on NetLogo, to visualise the tube network in real time: http://www.geotalisman.org/2014/04/29/another-day-another-tube-strike/. Visualisation of real-time data using agent based modelling techniques makes a lot of sense, especially when the geospatial data is already available on MapTube anyway.
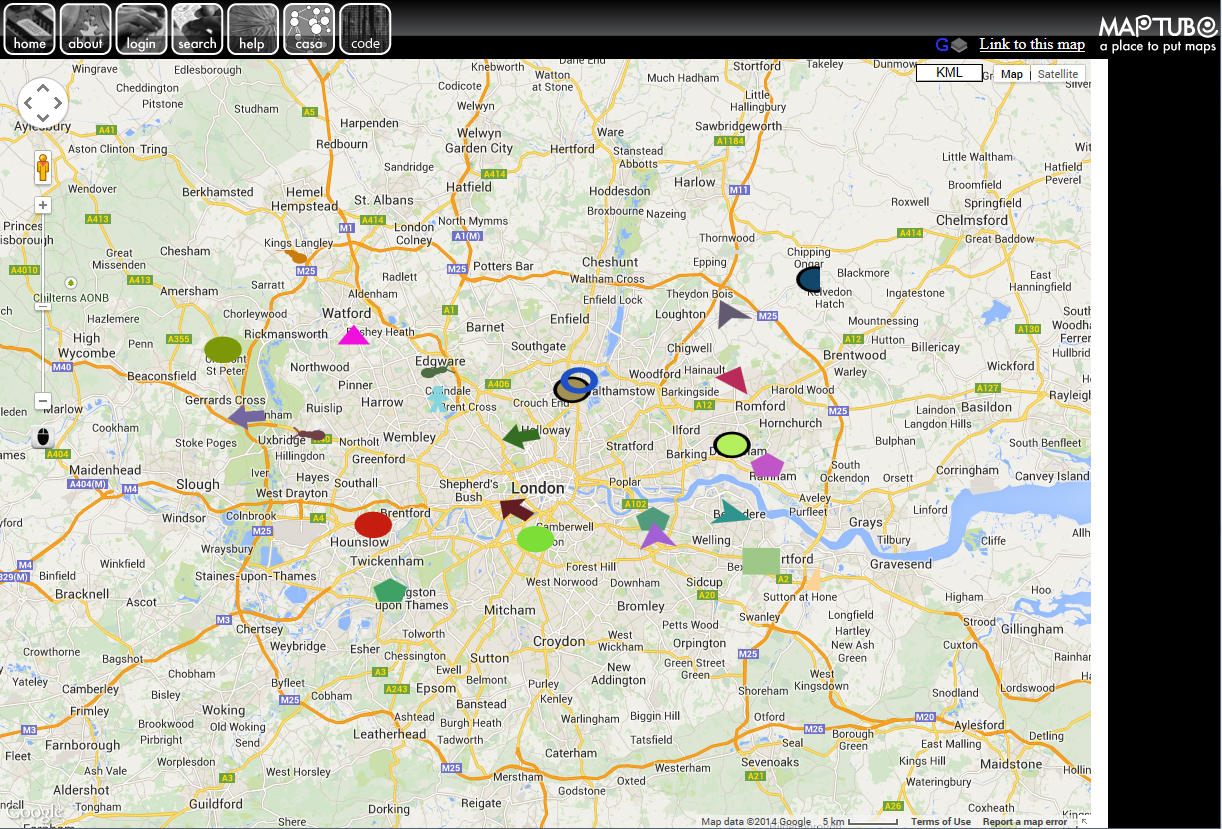
The following image shows a variation of the “AgentOverlay” class added as a new map type in MapTube:
This is the same simple example of agents moving randomly around a map as in the “Bugs on a Map” example, except that this time it’s integrated into MapTube as a “code” layer. The idea of a “programmable map” layer that you can experiment with is an interesting idea. By allowing programmable map layers, users can upload all kinds of interesting geospatial visualisations and are not just limited to choropleths.
It’s going to be a while before this new map type goes live though, as there are still a number of problems to be overcome. The datadrop needs to be modified to handle the code upload, but the biggest problem is with the scripts themselves. The “bugs” example above is written in coffeescript, so I’m having to compile the coffeescript into javascript at the point where it’s being included into the page. I liked the idea of something simpler than Javascript, so I could give the user a command line interface which he could use to create a map with. Sort of like a JSFiddle for maps (MapFiddle?).
MapTube is actually quite clever in how it handles map layers. What it does behind the scenes is to take an XML description of the map layers and transform this into the html page that you see in the browser. This makes it very easy to implement a lot of complex functionality as it’s all just transformational XML to XHTML plus a big chunk of library code. At the moment, though, I’m stuck with how to separate code in different map layers, while still being able to call the layer’s initialisation and get the overlay back. Then there are the cross site scripting problems which are making it difficult to load the tube network and real-time positions. Hopefully, a real-time tube demonstration on the live server isn’t far away.
I’ve been experimenting with 3D buildings in my virtual globe project and it’s now progressed to the point where I can demonstrate it working with dynamically loaded content. The following YouTube clip shows the buildings for London, along with the Thames. I didn’t have the real heights, so buildings are extruded up by a random amount and, unfortunately, so is the river, which is why it looks a bit strange. The jumps as it zooms in and out is me flicking the mouse wheel button, but the YouTube upload seems to make this and the picture quality a lot worse than the original:
Performance is an interesting thing as these movies were all made on my home computer rather than my iMac in the office. The green numbers show the frame rate. My machine is a lot faster as it’s using a Crucial SSD disk, so the dynamic loading of the GeoJSON files containing the buildings is fast enough to run in real time. The threading and asynchronous loading of tiles hasn’t been completed yet, so, when new tiles are loaded, the rendering stalls briefly.
On demand loading of building tiles is a big step up from using a static scene graph. The way this works is to calculate the ground point that the current view is over and render a square of nine tiles centred on the viewer’s ground location. Calculation of latitude, longitude and height from 3D Cartesian coordinates is an interesting problem that ends up having to use the Newton-Raphson approach. This still needs some work as it’s obvious from the movies that not enough content ahead of the viewer is being drawn. As the view moves around, the 3×3 grid of ground tiles is shuffled around and any new tiles that are required are loaded into the cache.
Working on the principle that tiles are going to be loaded from a server, I’ve had to implement a data cache based on the file URI (just like MapTubeD does). When tiles are requested, the GeoJSON files are moved into the local cache, loaded into memory, parsed, triangulated using Poly2Tri, extruded and converted into a 3D mesh. Based on how long the GeoJSON loading is taking on my iMac, a better solution is to pre-compute the 3D geometry to take the load off of the display software. At the moment I’m using a Java program I created to make vector tiles (GeoJSON) out of a shapefile for the southeast of England. I’ve assumed the world to be square (-180,-180 to 180,180 degrees) then cut the tiles using a quadtree system so that they’re square in WGS84. Although this gives me a resolution problem and non-square 3D tiles, it works well for testing. The next step is to pre-compute the 3D content and thread the data loading so it works at full speed.
Finally, this was just something fun I did as another test. Earth isn’t the only planet, other planets are available (and you can download the terrain maps)…