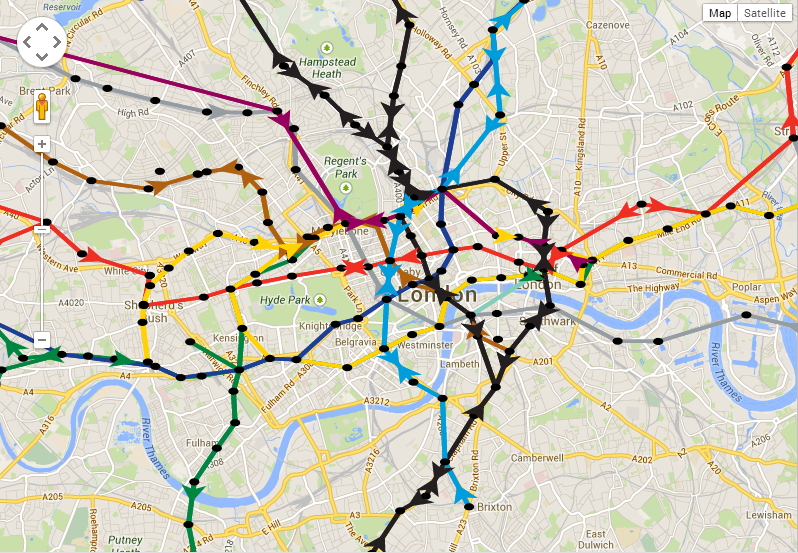
The image above is the position of all the tubes at 09:47 this morning, 29th April 2014.
As I was walking into work though, I was looking at the licence numbers of all the old Routemaster buses that TfL had put on as extra services. It’s a bus spotter’s paradise out there with all the old buses that are being driven around Central London. The problem, though, is that they don’t seem to have the same tracking devices on them as the regular buses, so they don’t appear on the Countdown API stream. This is potentially a big problem with collecting data on how the strike affects London, as we’re obviously missing some key information.
One good thing is that we now have access to road traffic data, so that might be worth analysing during tonight’s rush hour. Also, the people tracking project that I’ve been working on for a while is almost ready for testing.
I’ve been getting increasingly frustrated with the tools available to visualise the tube, bus and train data I’ve been collecting, so I’ve ended up creating my own. If you’re wondering why some of the lines don’t have any tubes in the above diagram, it’s because I’ve got the speed set very high and I’m not picking the new route correctly when there is a choice.
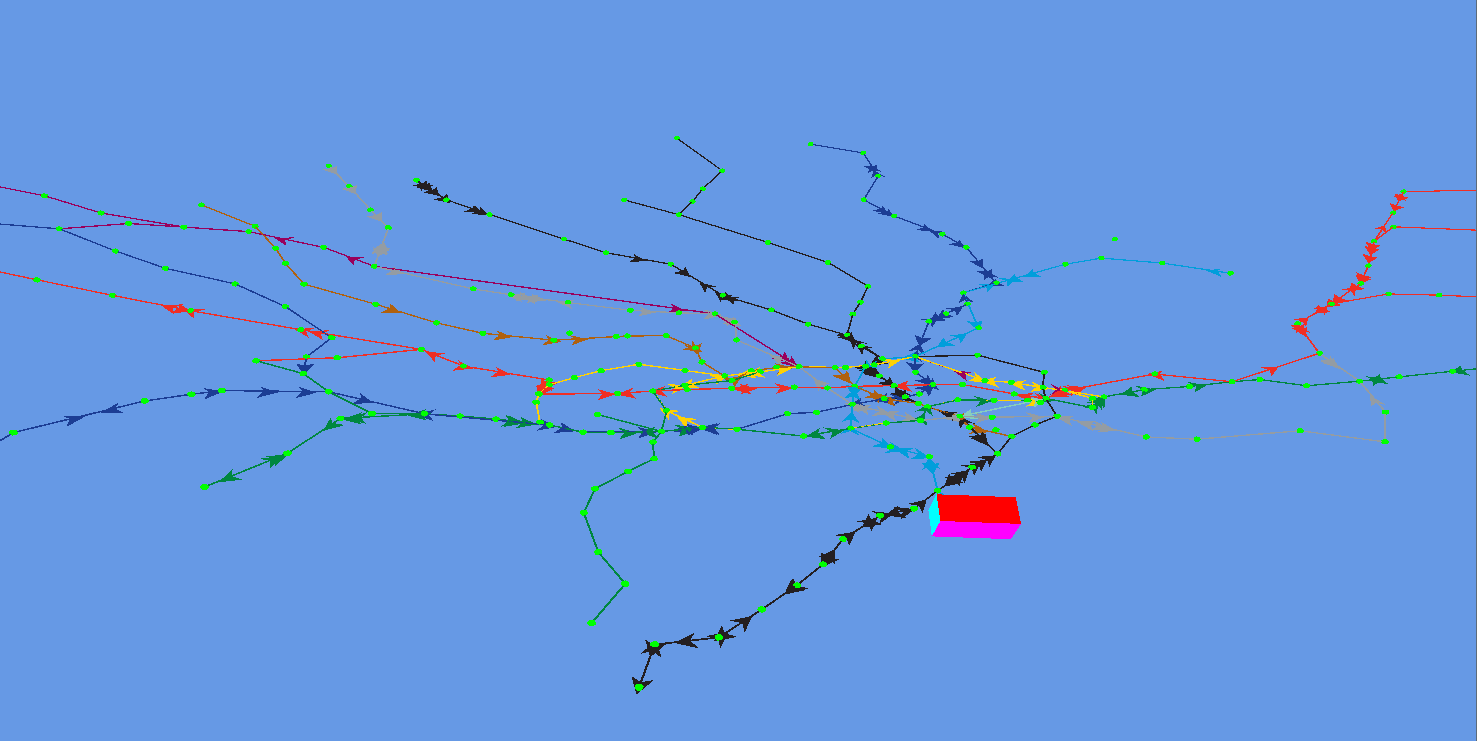
The image above is an OpenGL visualisation in C++, but based on my experience with the AgentScript (2D) and Three.js (3D) browser based visualisations. Essentially, I wanted something that would allow me to create the animations that I’ve been using 3DS Max for, but in a much simpler way. The following is a bus animation that I built for a recent presentation:
This was created using 3DS Max, with some custom MaxScript code to load the bus positions and create the animation key frames. The main problem with this is the scale of the data, which is why I had to limit it to between 09:00 and 12:00. Art tools generally don’t like to handle this quantity of data and I’ve also had issues with packages like Unity and Lumion.
Increasingly, I’ve been moving towards the idea of “Programmable Maps” where the visualisation is built through a series of stages which load the data, apply behaviours to elements of the scene that move and produce an impressive 2D or 3D visualisation with advanced lighting or tilt shift in the same way as ViziCities. The use of APIs and 3rd party libraries to obtain the real-time data, along with the temporal aspect, makes it very difficult to fit this type of visualisation into a conventional GIS framework.
The example above is built around a C++ and OpenGL graphics engine, but one that is linked with geospatial libraries so it’s more than just a game engine rendering 3D assets as artwork. The experience with the XBox tubes demo (C#, XNA) and Chrome Three.js example showed that it’s a nightmare to get the geometry in the correct place and orientation unless it’s properly georeferenced. Working with the live tube data, where the API can only be queried every 3 minutes, leads to a real-time visualisation where positions are effectively being forecast between data updates. Putting all this together results in a requirement for a geospatially aware graphics engine linked with an agent based modelling package that allows us to code behaviours for the elements that are moving.
The programmable maps part doesn’t really come into play until you increase the level of sophistication and start to layer additional levels of processing. For example, bus positions are calculated based on arrival times at the next stop. This is a graph technique where you interpolate the time between nodes, but, in order to visualise the positions correctly, this position along the link needs to be applied to a road network to find the real position on the ground. Otherwise you get buses driving through the river and not using the bridges.
What I’m describing is a workflow for geospatial data to go from the raw data through to visualisation using library building blocks and web services where appropriate. There is one final trick to this approach though, as we could use it to make a visualisation directly from a NetLogo agent based model. A while ago I showed how to run the NetLogo program inside a Java program and capture the positions of the agents which can then be loaded into 3DS Max. Exactly the same thing could be applied here, with a NetLogo simulation driving the 3D engine.