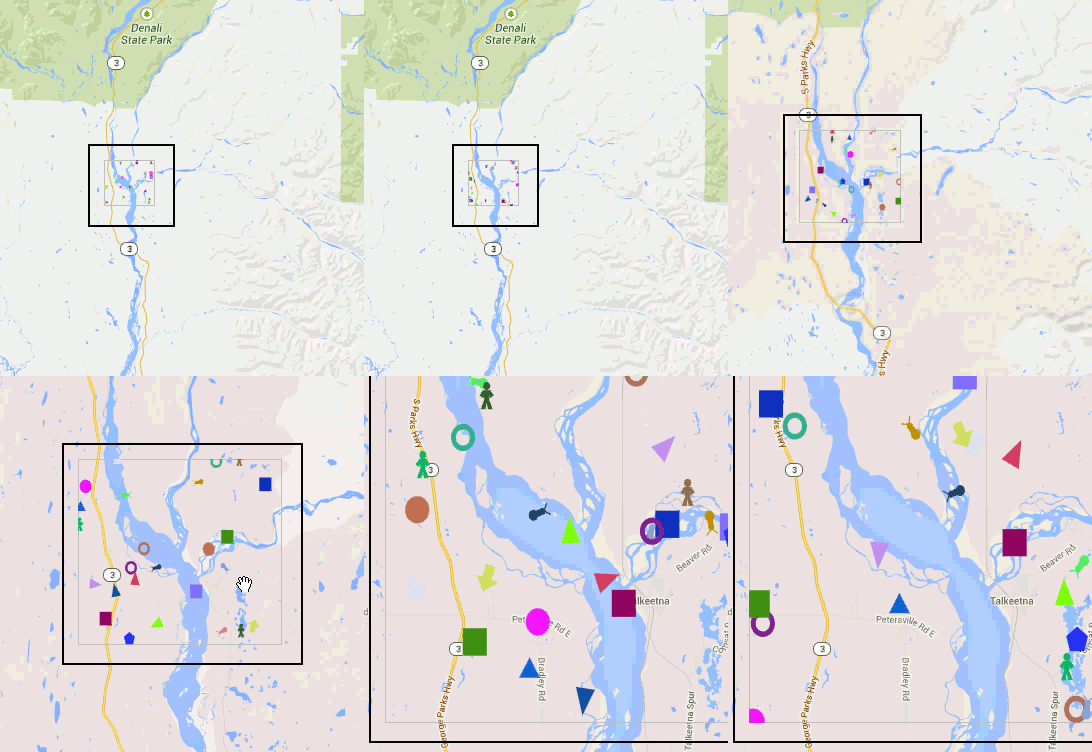
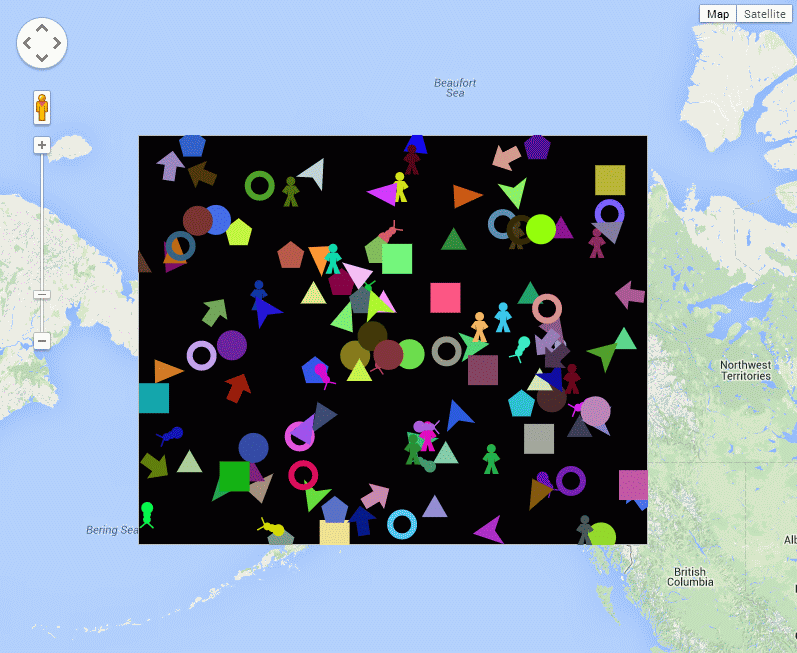
Maybe I’ve been staring at agent based models running on Google Maps for too long, but it does look as though the map is infested with bugs which are crawling all over it. Have a look at the animation below:

This is a Talisman deliverable, which we’ve called “ModelTube”, as the general idea is to be able to run models on MapTube maps in a similar way to how the Modelling 4 All site works with Java Applets. The concept of a framework for “programmable maps” is an interesting one as it allows us to integrate code for calculating real-time positions of tubes, buses and trains based on their last known position, with all the animation happening on the browser. Essentially, what we’re doing here is running Logo on a map to create a visualisation of the data in space and time. The next step is to include some of our city diagnostics about expected frequency of transport services to highlight were problems are occurring, but it’s also possible to couple that with an additional layer of intelligence about the people using the services to predict where the biggest problems are likely to be in the next few minutes (now-casting for cities).
As this is a follow up to my last post about running agent based models on Google Maps using AgentScript, I’m only going to highlight the changes needed to give the agents a geographic context. I’ve sorted out the scaling and position of the canvas that defines the agent world, so they now run inside a lat/lon box that I can define with the zoom in and out functioning correctly. The solid black outline in the animation above is a frame that I’ve added 16 pixels outside of the agent box so that I can verify that it is in the correct position. The lighter grey frame is the edge of the agent canvas which corresponds to my lat/lon bounding box.
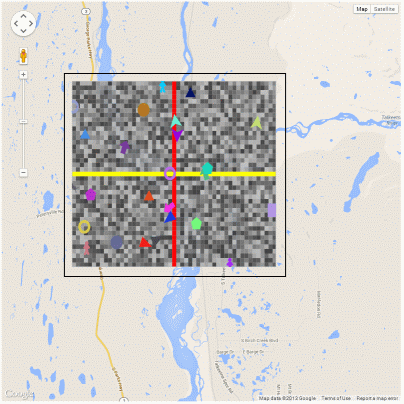
In the map above, I’ve removed the patches and made the agent canvas transparent so you can see the map underneath. With the patches turned back on it looks like this:

The only problem with this technique is that the agent based model runs in its own agent space, which is then mapped to a lat/lon box on the map, which the Google Maps API then reprojects into Mercator. This is the same situation as the GIS extension for NetLogo, where the model runs in its own coordinate space and you define a transform which is used when importing geographic data from shapefiles. The consequence of this is that the model is really running in a Mercator coordinate system, but, given that models tend to model small-scale phenomena, this might not be such a big issue.
For completeness, here are the changes I’ve made to the code to create a Google Maps overlay containing the AgentScript model (coffeescript):
[code language=”javascript”]
class AgentOverlay extends google.maps.OverlayView
constructor: (@id_, @bounds_, @map_) ->
console.log("Building AgentOverlay called ‘"+@id_+"’")
@div_=null
@setMap(@map_)
onAdd: () ->
#console.log("add")
div = document.createElement(‘div’)
div.id=@id_ #+’_outer’
div.style.borderStyle=’none’
div.style.borderWidth=’0px’
div.style.position=’absolute’
div.style.backgroundColor=’#f00′
@div_=div
panes = this.getPanes()
panes.overlayLayer.appendChild(@div_)
#now that the div (s) have been created we can create the model
# div, size, minX, maxX, minY, maxY, torus=true, neighbors=true
#NOTE: canvas pixels = size*(maxX-minX), size*(maxY-minY)
#where size is the patch size in pixels (w and h) and min/max/X/Y are in patch coordinates
@model_ = new MyModel "layers", 5, -25, 25, -20, 20, true
@model_.debug() # Debug: Put Model vars in global name space
@model_.start() # Run model immediately after startup initialization
draw: () ->
#console.log("draw")
overlayProjection = @getProjection()
sw = overlayProjection.fromLatLngToDivPixel(@bounds_.getSouthWest())
ne = overlayProjection.fromLatLngToDivPixel(@bounds_.getNorthEast())
geoPxWidth = ne.x-sw.x #width of map canvas
geoPxHeight = sw.y-ne.y #height of map canvas
div = @div_
div.style.left = sw.x+’px’
div.style.top = ne.y+’px’
div.style.width = geoPxWidth+’px’
div.style.height = geoPxHeight+’px’
#go through each context (canvas2d or image element) and change its size, scaling and translation
for name, ctx of ABM.contexts #each context is a layer i.e. patches, image, drawing, links, agents, spotlight (ABM.patches, ABM.agents, ABM.links)
#console.log(name)
if ctx.canvas
ctx.canvas.width=geoPxWidth
ctx.canvas.height=geoPxHeight
#Drawing on the canvas is in patch coordinates, world.size is the size of the patch i.e. 5 in new MyModel "layers", 5, -25, 25, -20, 20
#Patch coordinates are from the centre of the patch.
#The scaling would normally be so that 1 agent coord equals the patch width (i.e. 5 pixels or world.size).
#We need to make the agent world fit the geoPxWidth|Height, so take the normal scaling (world.size) and multiply by geowidth/world.pxWidth to
#obtain a new scaling in patch coords that fits the map canvas correctly.
ctx.scale geoPxWidth/@model_.world.pxWidth*@model_.world.size, -geoPxHeight/@model_.world.pxHeight*@model_.world.size
#The translation is the same as before with minXcor=minX-0.5 (similarly for Y) and minX=-25 in new MyModel "layers", 5, -25, 25, -20, 20
#Code for this can be found in agentscript.coffee, in the setWorld and setCtxTransform functions
ctx.translate -@model_.world.minXcor, -@model_.world.maxYcor
#@model_.draw(ctx) #you need to force a redraw of the layer, otherwise it isn’t displayed (MOVED TO END)
else
#it’s an image element, so just resize it
ctx.width=geoPxWidth
ctx.height=geoPxHeight
ABM.model.draw(true) #forces a redraw of all layers
#u.clearCtx(ctx) to make the context transparent?
#u.clearCtx(ABM.contexts.patches)
onRemove: () ->
#console.log("remove")
@div_.parentNode.removeChild(@div_)
@div_=null
[/code]
All that’s left now is to wrap all this up into a library and publish it. And maybe do something useful with it?

