Three Days and Two Nights at the Museum

As part of the ESRC Festival of Social Science, CASA and Leeds University held a three day event at Leeds City museum called “Smart Cities: Bridging the Physical and Digital”. This took place on the 8th, 9th and 10th of November.

The London Table and City Dashboard on the main overhead screen, plus tweetometer on the side screens

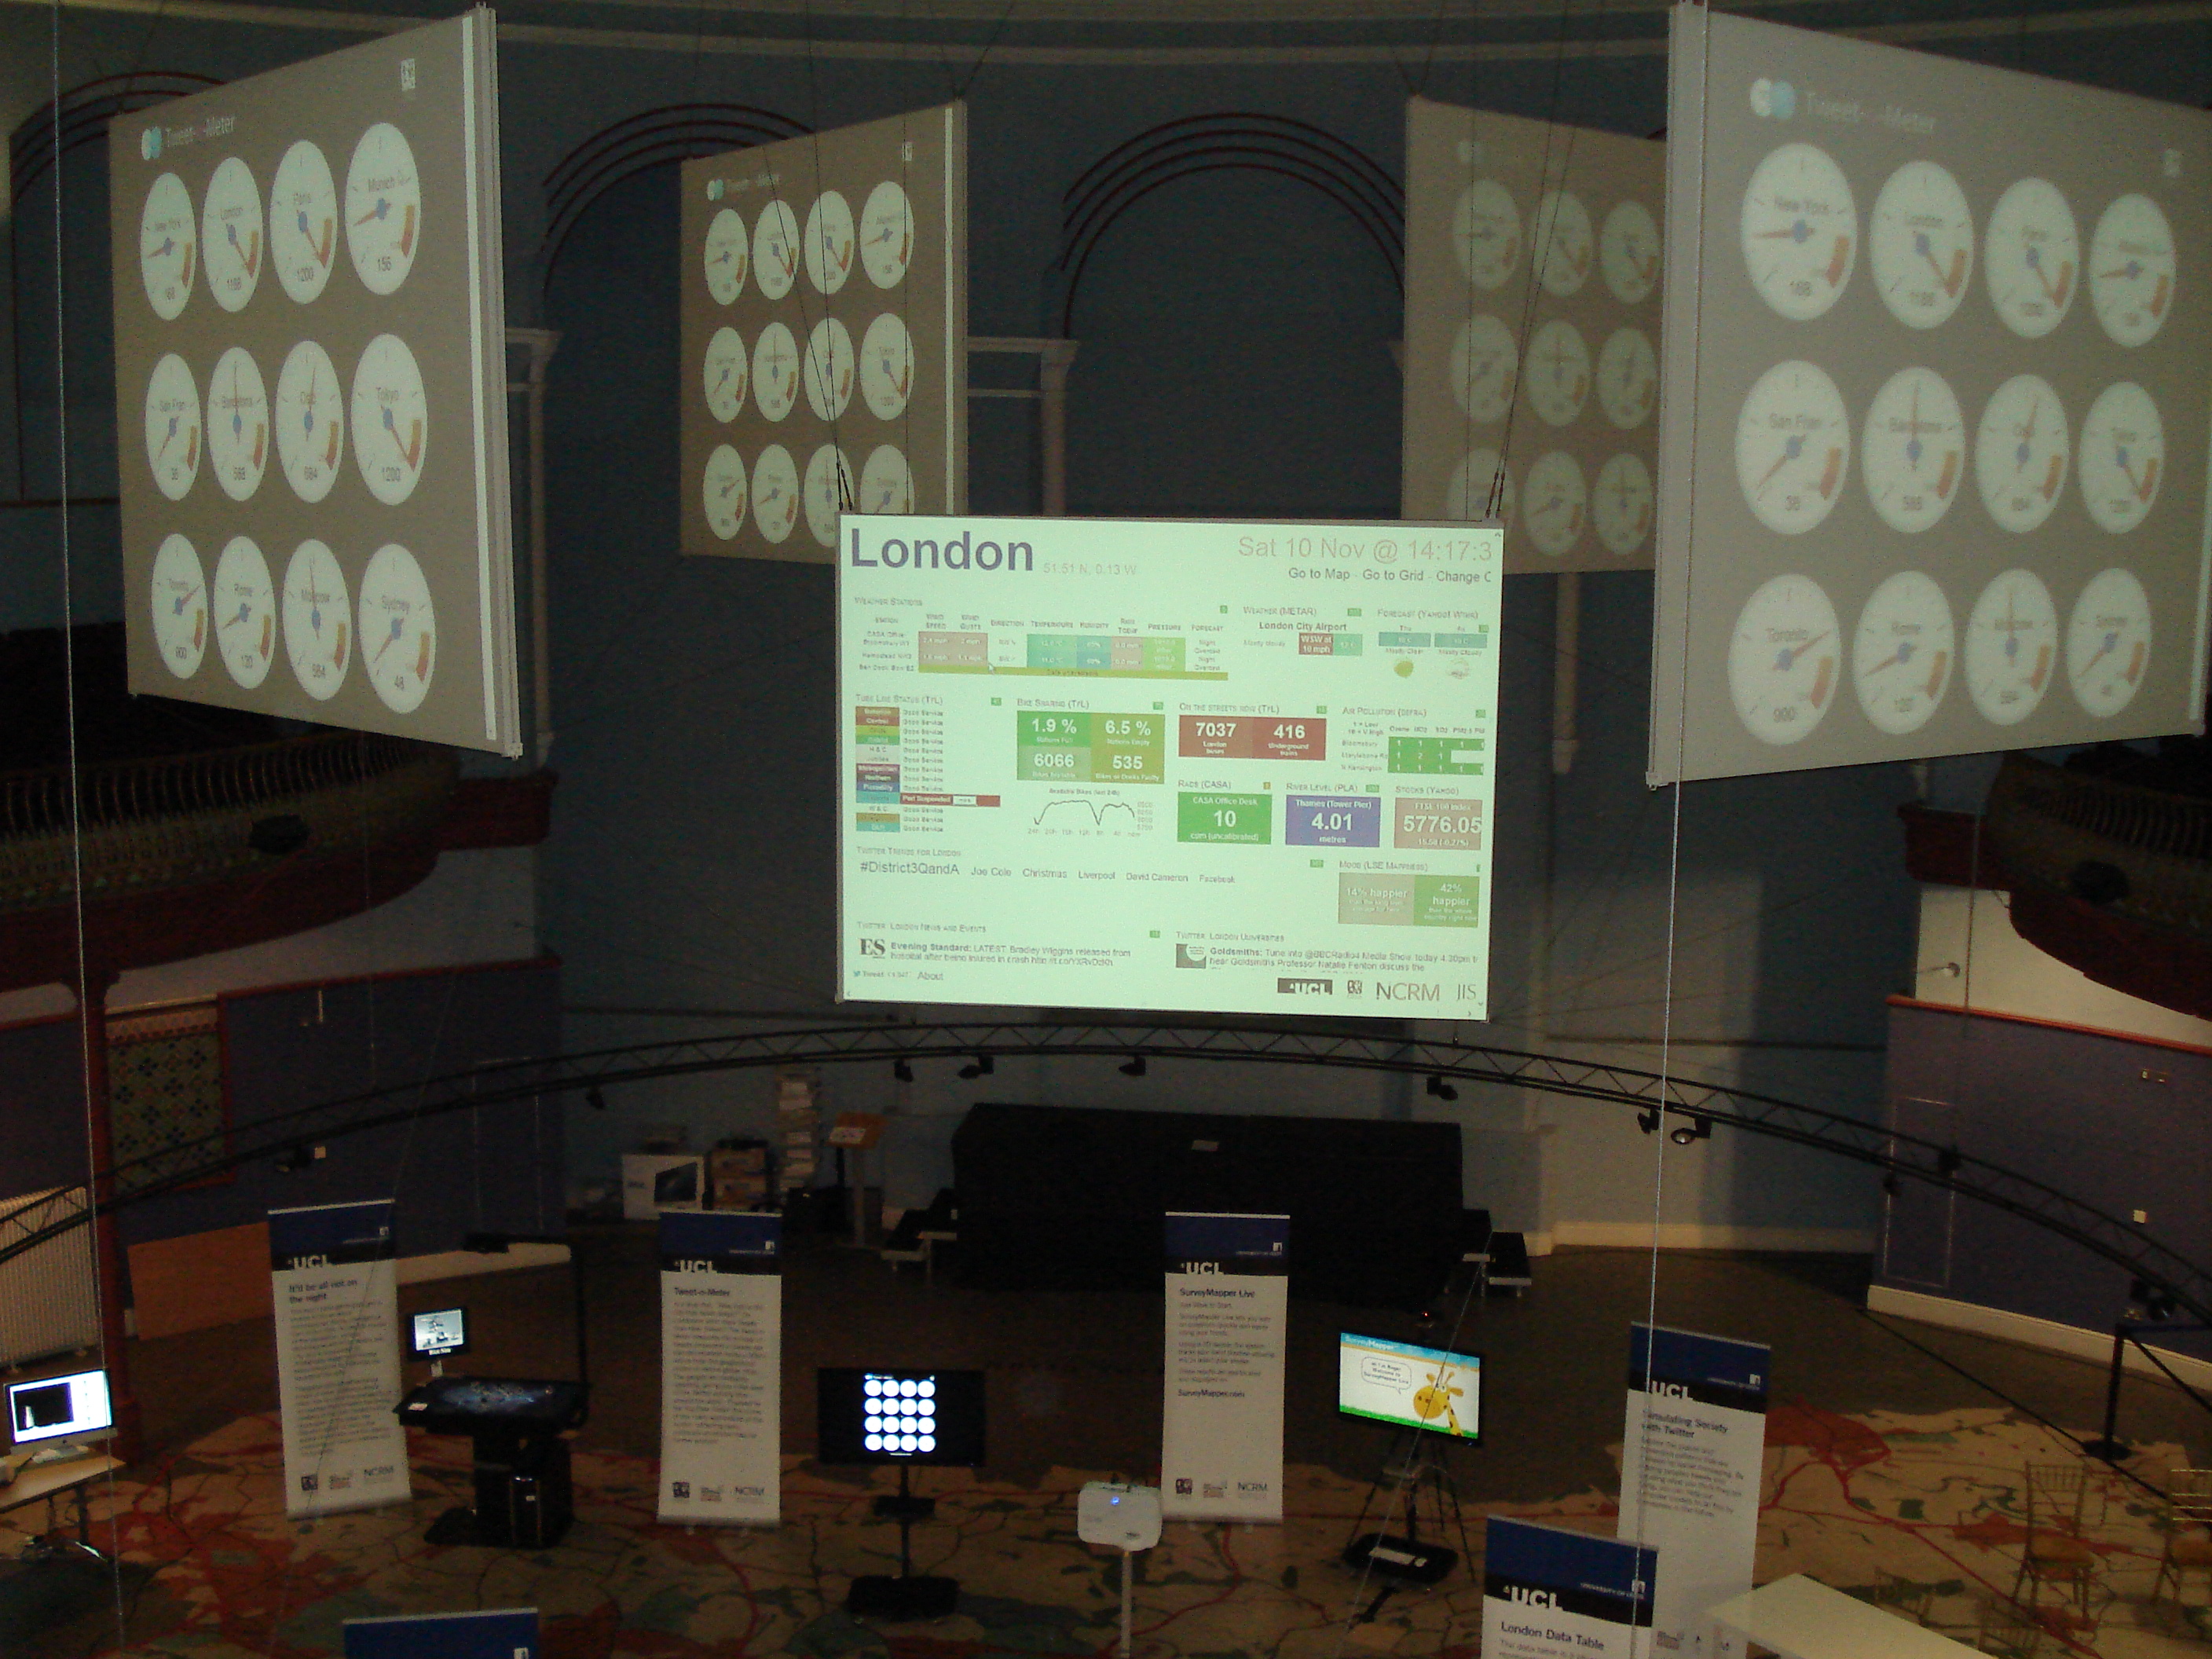
The museum’s central arena venue for the exhibition was a fantastic choice because of the domed roof and suspended overhead screens (see picture). There was also a map of the Leeds area set into the floor and a gallery on the first floor where people could look down on the exhibits and take pictures.

The timing of the event also coincided with a market in the square outside and a number of children’s events taking place in the museum on the Saturday, so we had plenty of visitors.

Although this was a follow-up to the Smart Cities event which we did in London in April, there were a number of additions and changes to exhibits. Firstly, we added a second pigeon sim which was centred on Leeds City museum, in addition to the London version centred on City Hall. Although we expected the Leeds one to be popular, people seemed to be fascinated by the London version and the fact that you could fly around all the famous landmarks. I spent a lot of time giving people directions to the Olympics site and pointing out famous places. Having watched a lot of people flying around London it might be interesting to see how it changes their spatial perception as a lot of people don’t realise how small some things are and how densely packed London is.

Leeds Pigeon Sim and Riots Table
The Leeds Pigeon Sim on the left, with the image on the projector showing Leeds City museum

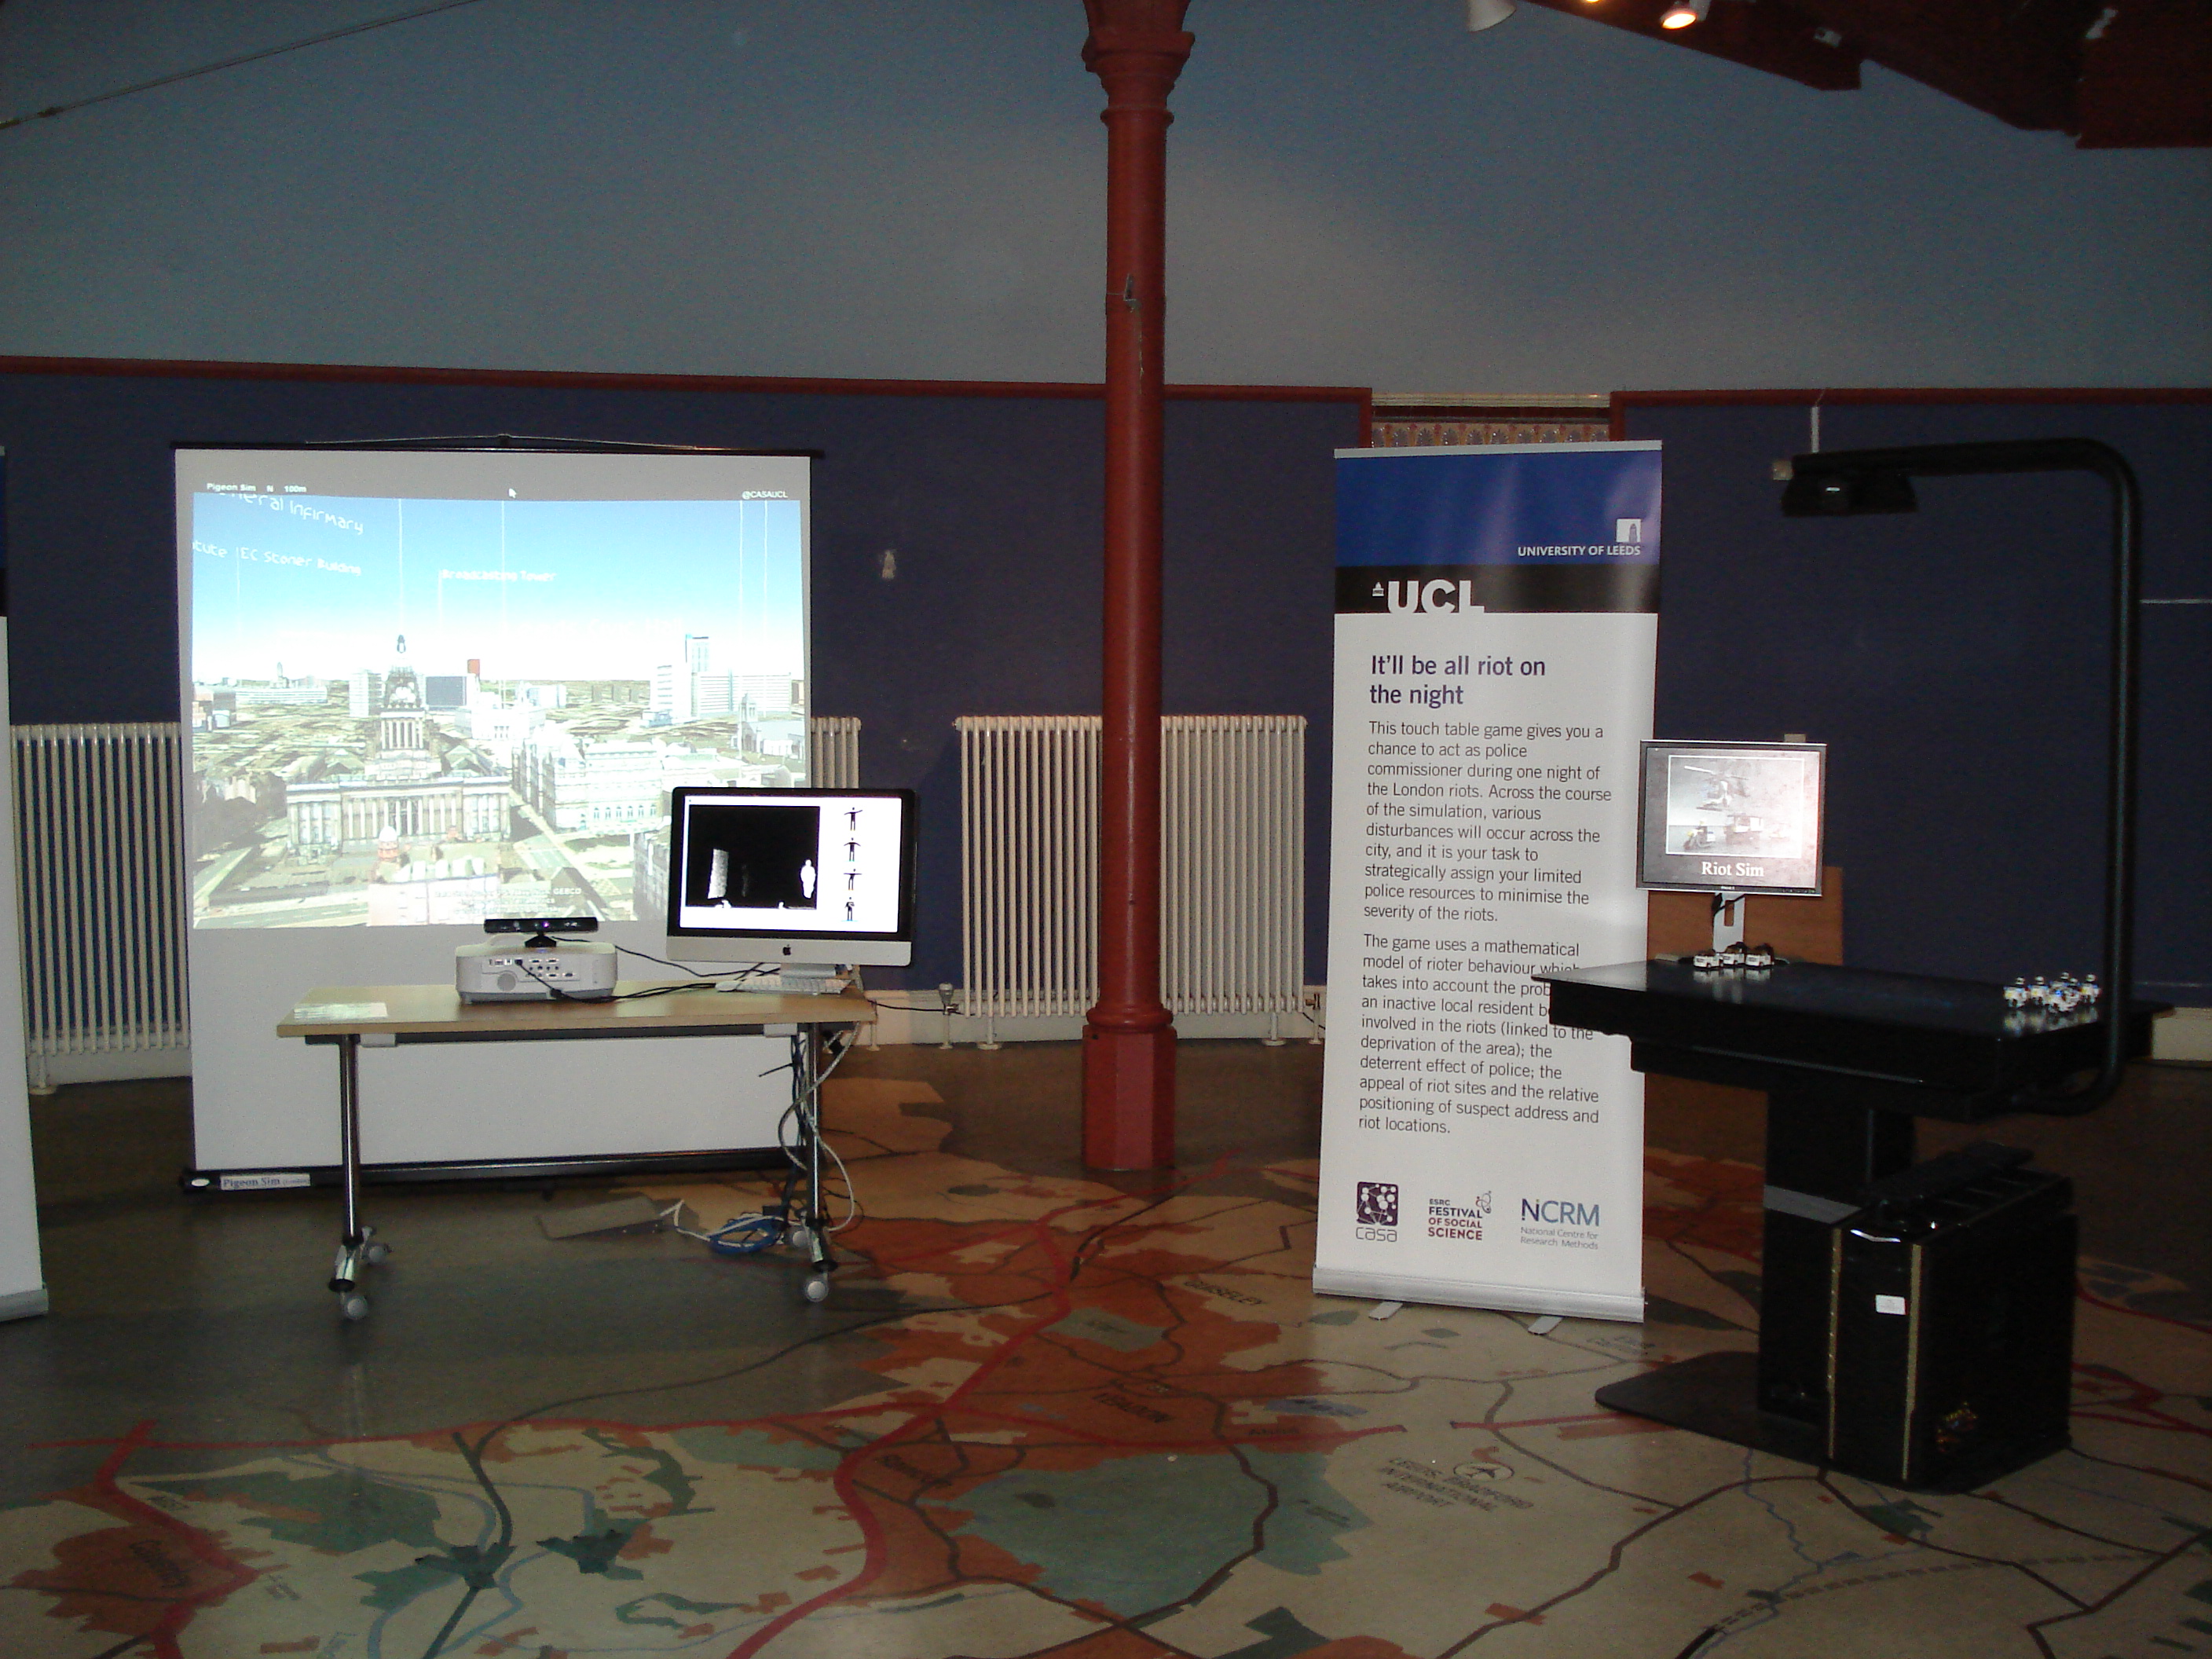
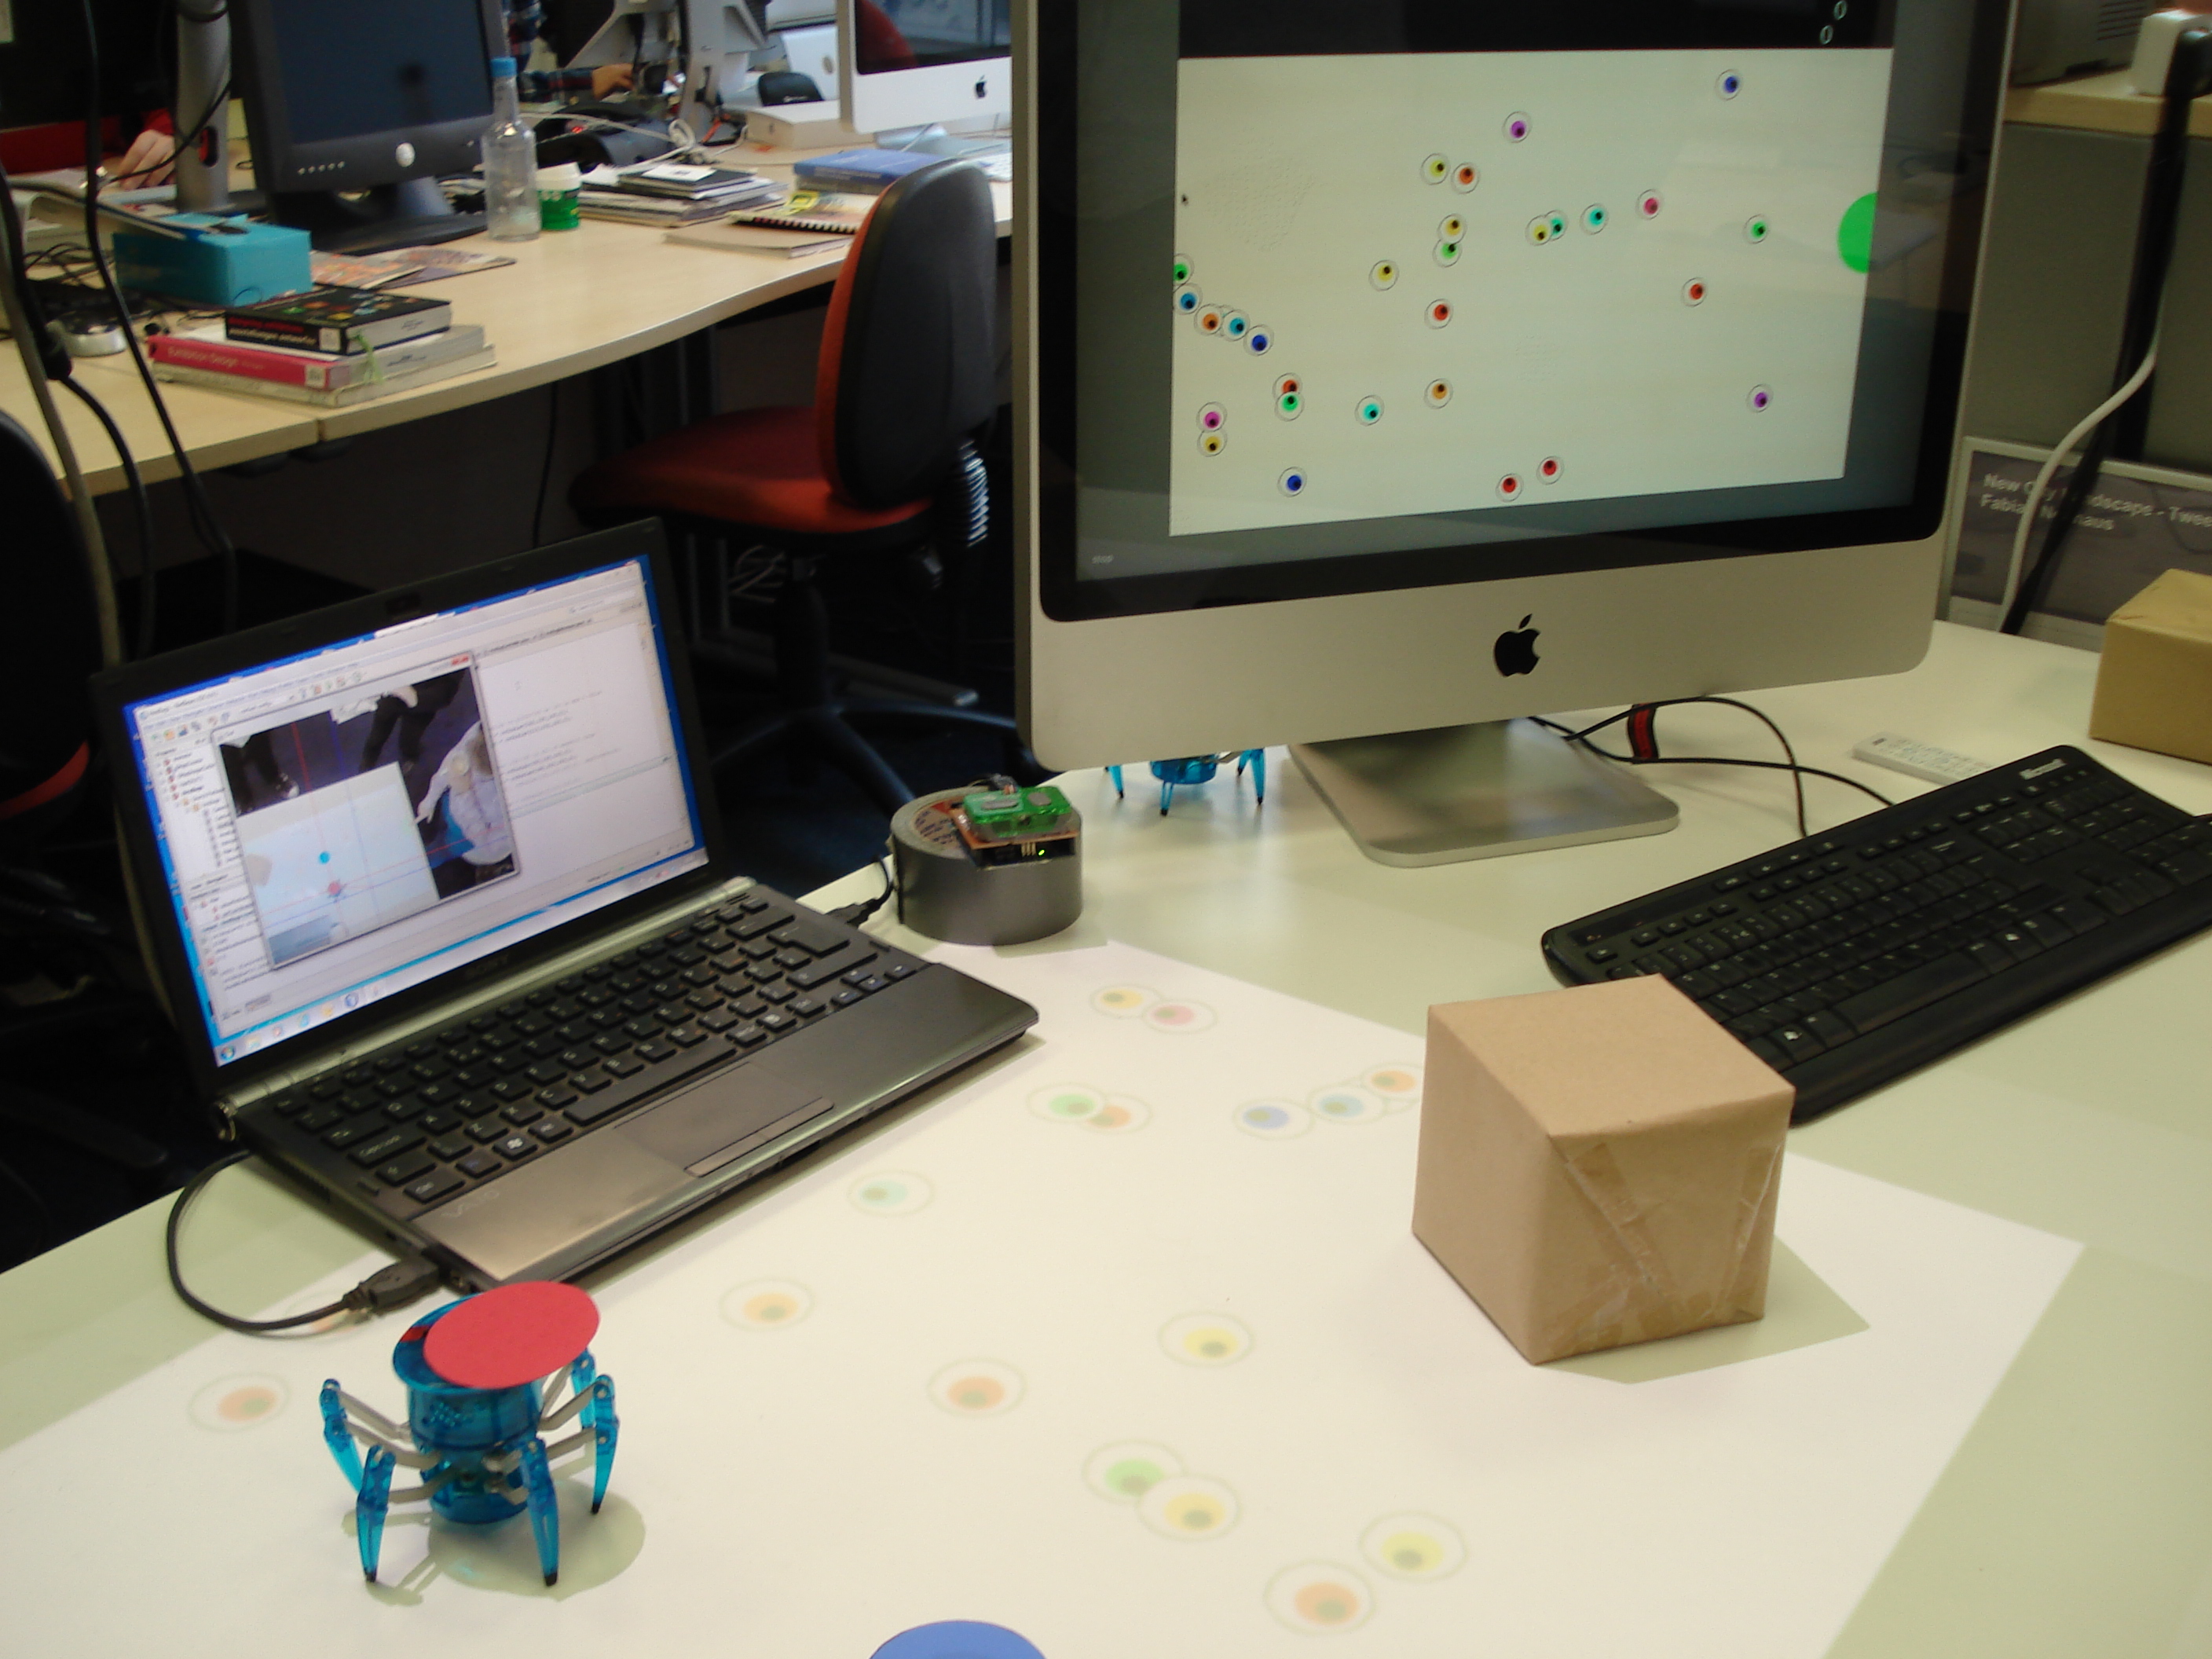
Both the pigeon sims use Google Earth, controlled via an XBox Kinect and its skeleton tracking. This has always worked very well in practice, but did require some height adjustment for the under fives. The image on the right also shows the riots table which uses another Kinect camera to sense Lego Police cars on the surface of the table. A model of the London riots runs on the computer and displays a map on the table which players use the Police cars to control. The Lego cars survived fairly well intact, despite being continually broken into pieces and lots of children enjoyed rebuilding them for us.

Another change to the London “Smart Cities” exhibition was the addition of the HexBug spiders to the Roving Eye exhibit. Previous posts have covered how a HexBug spider was modified to be controlled from a computer.

The Roving Eye and HexBug Spiders table showing the computers that control both parts with a spider on the table in the middle

The original “Roving Eye” projected “eyeball” agents onto the table and used a Kinect camera to sense objects placed on the table which formed barriers. The addition of the HexBug spider adds a physical robot which moves around the table and can be detected by the Kinect camera, causing the eyeballs to avoid it. This exhibit is built from two totally separate systems, with the iMac, Kinect and projector running the Roving Eye processing sketch (left computer), while the Windows 7 machine (right) uses a cheap webcam, Arduino, OpenCV and modified HexBug transmitter to control the spider. This is an interesting mix of the “Bridging the Physical and Digital”, and there were a lot of discussions with visitors during the three days of the exhibition about crowd modelling in general.

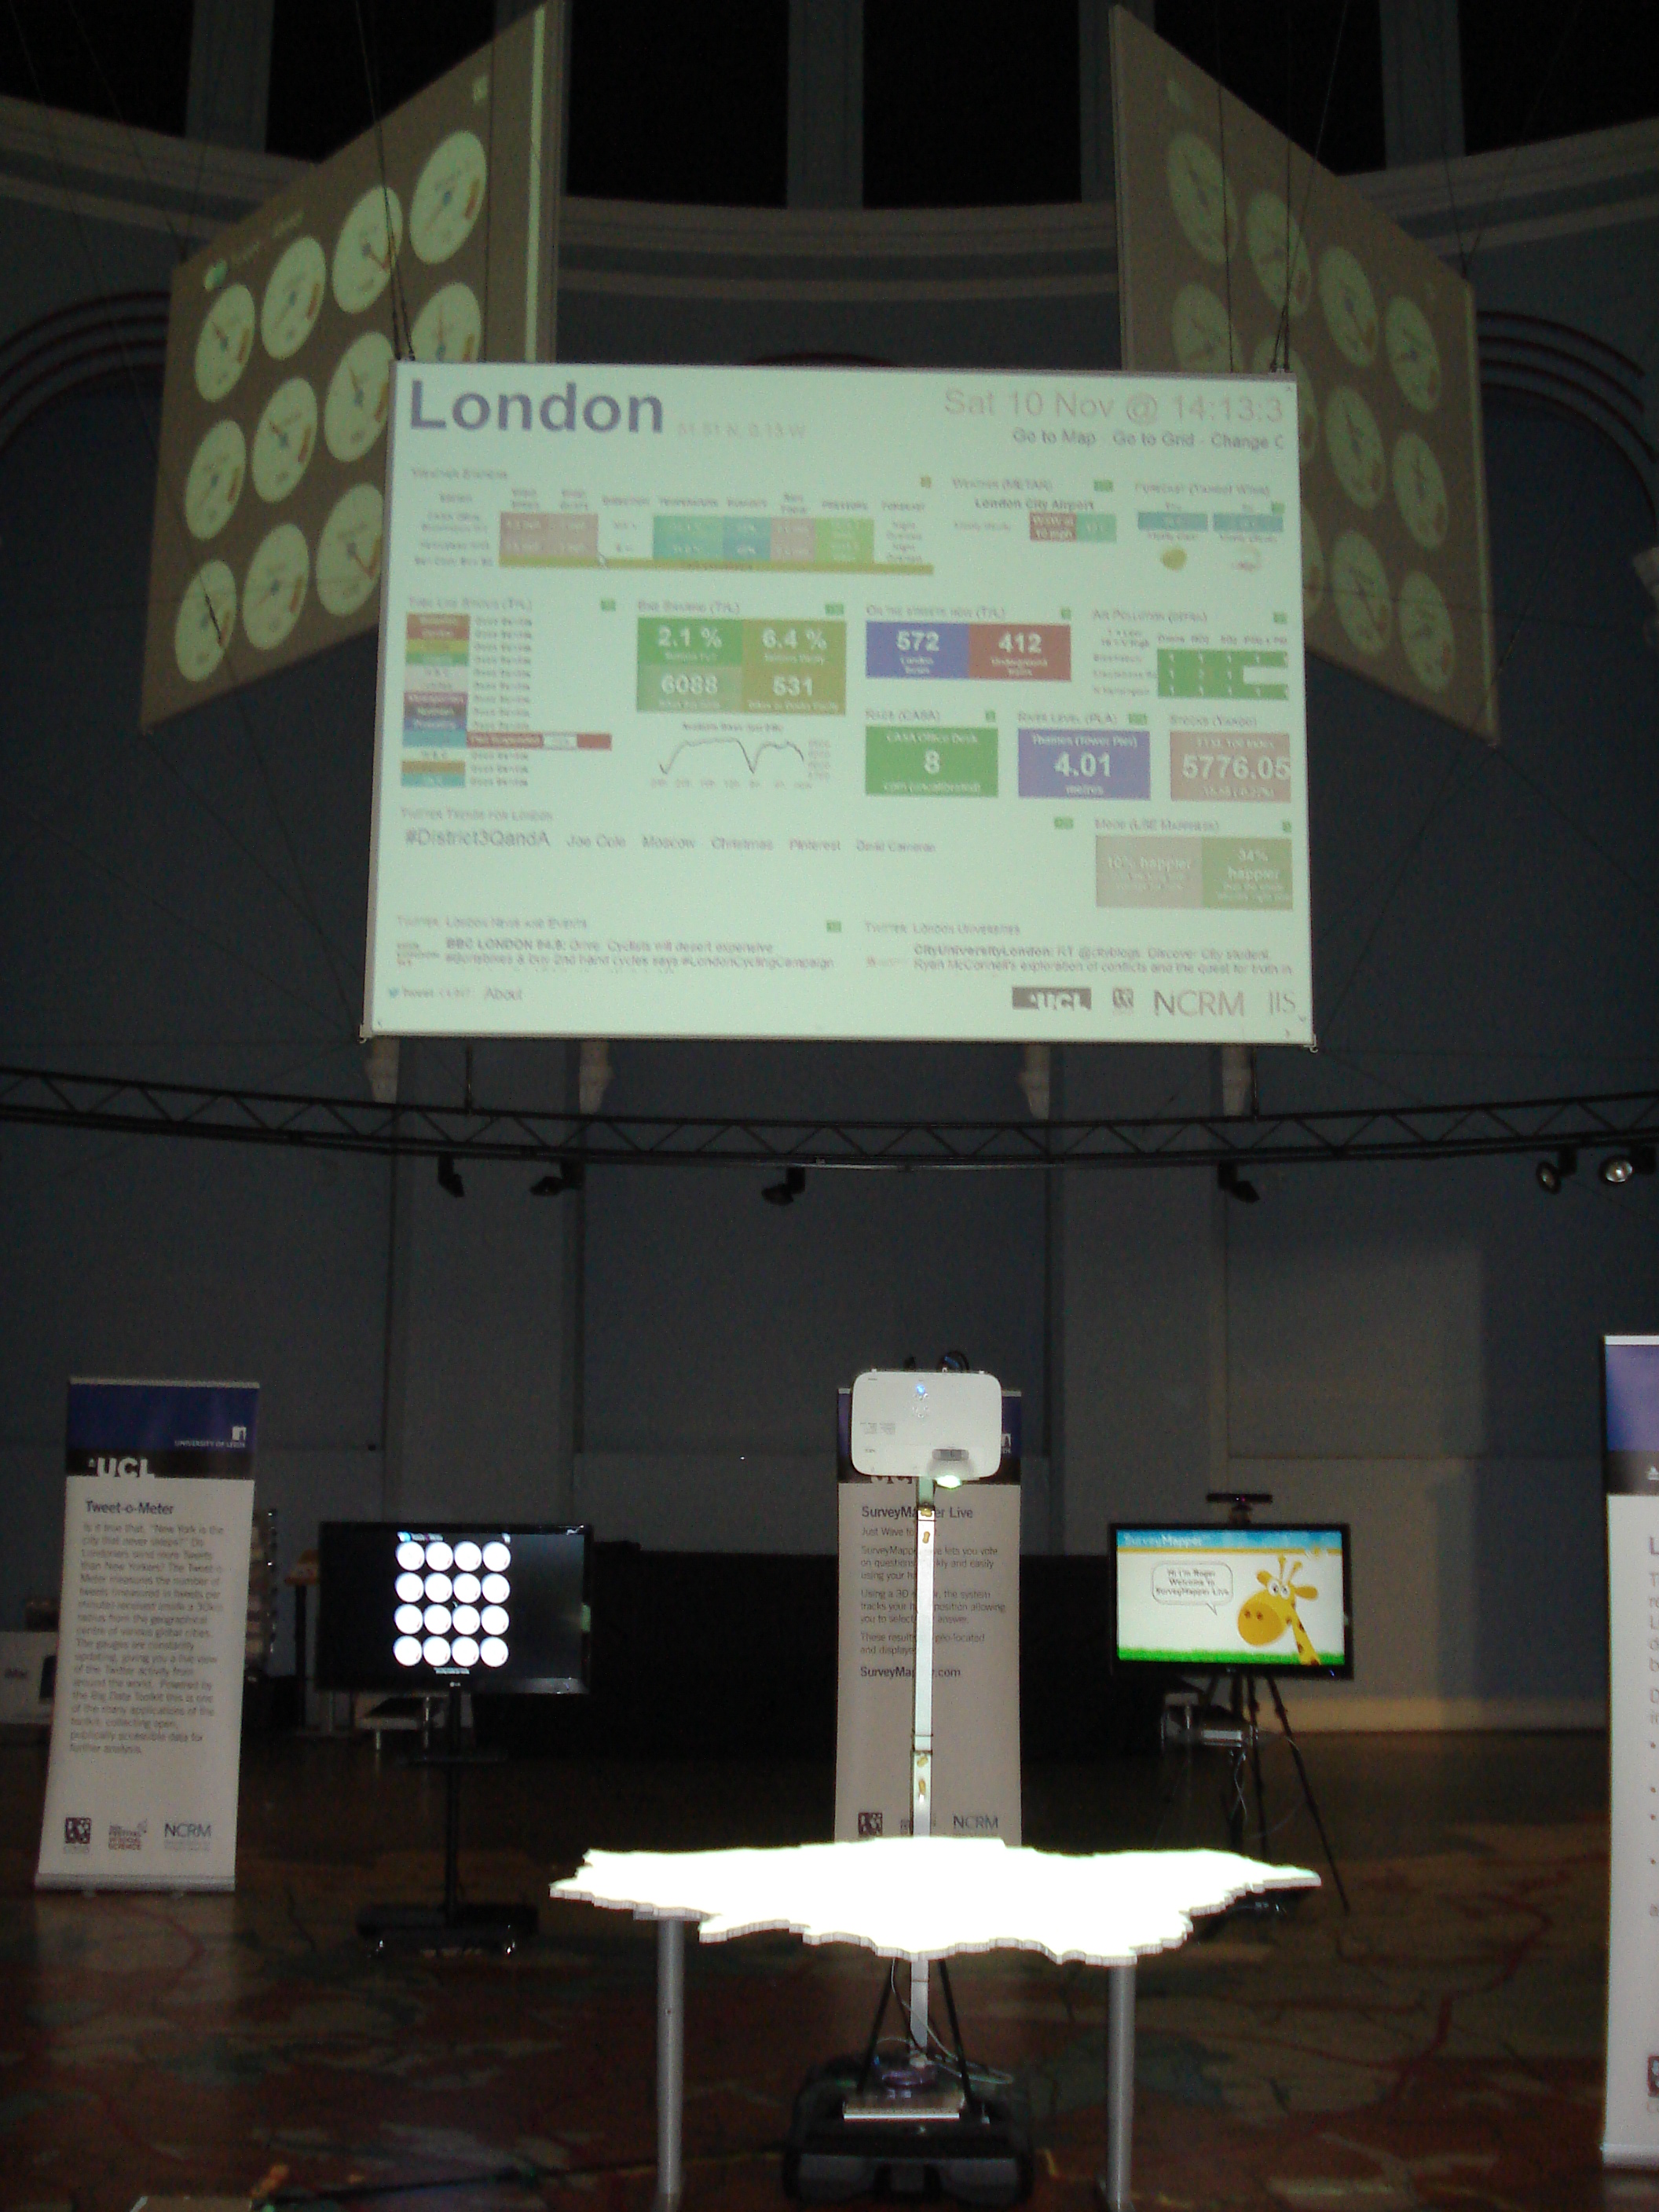
Also new for the Leeds exhibition was the Survey Mapper Live exhibit, which allows people to vote in a Survey Mapper survey by standing in front of the screen and waving their hand over one of the four answers.

Survey Mapper Live

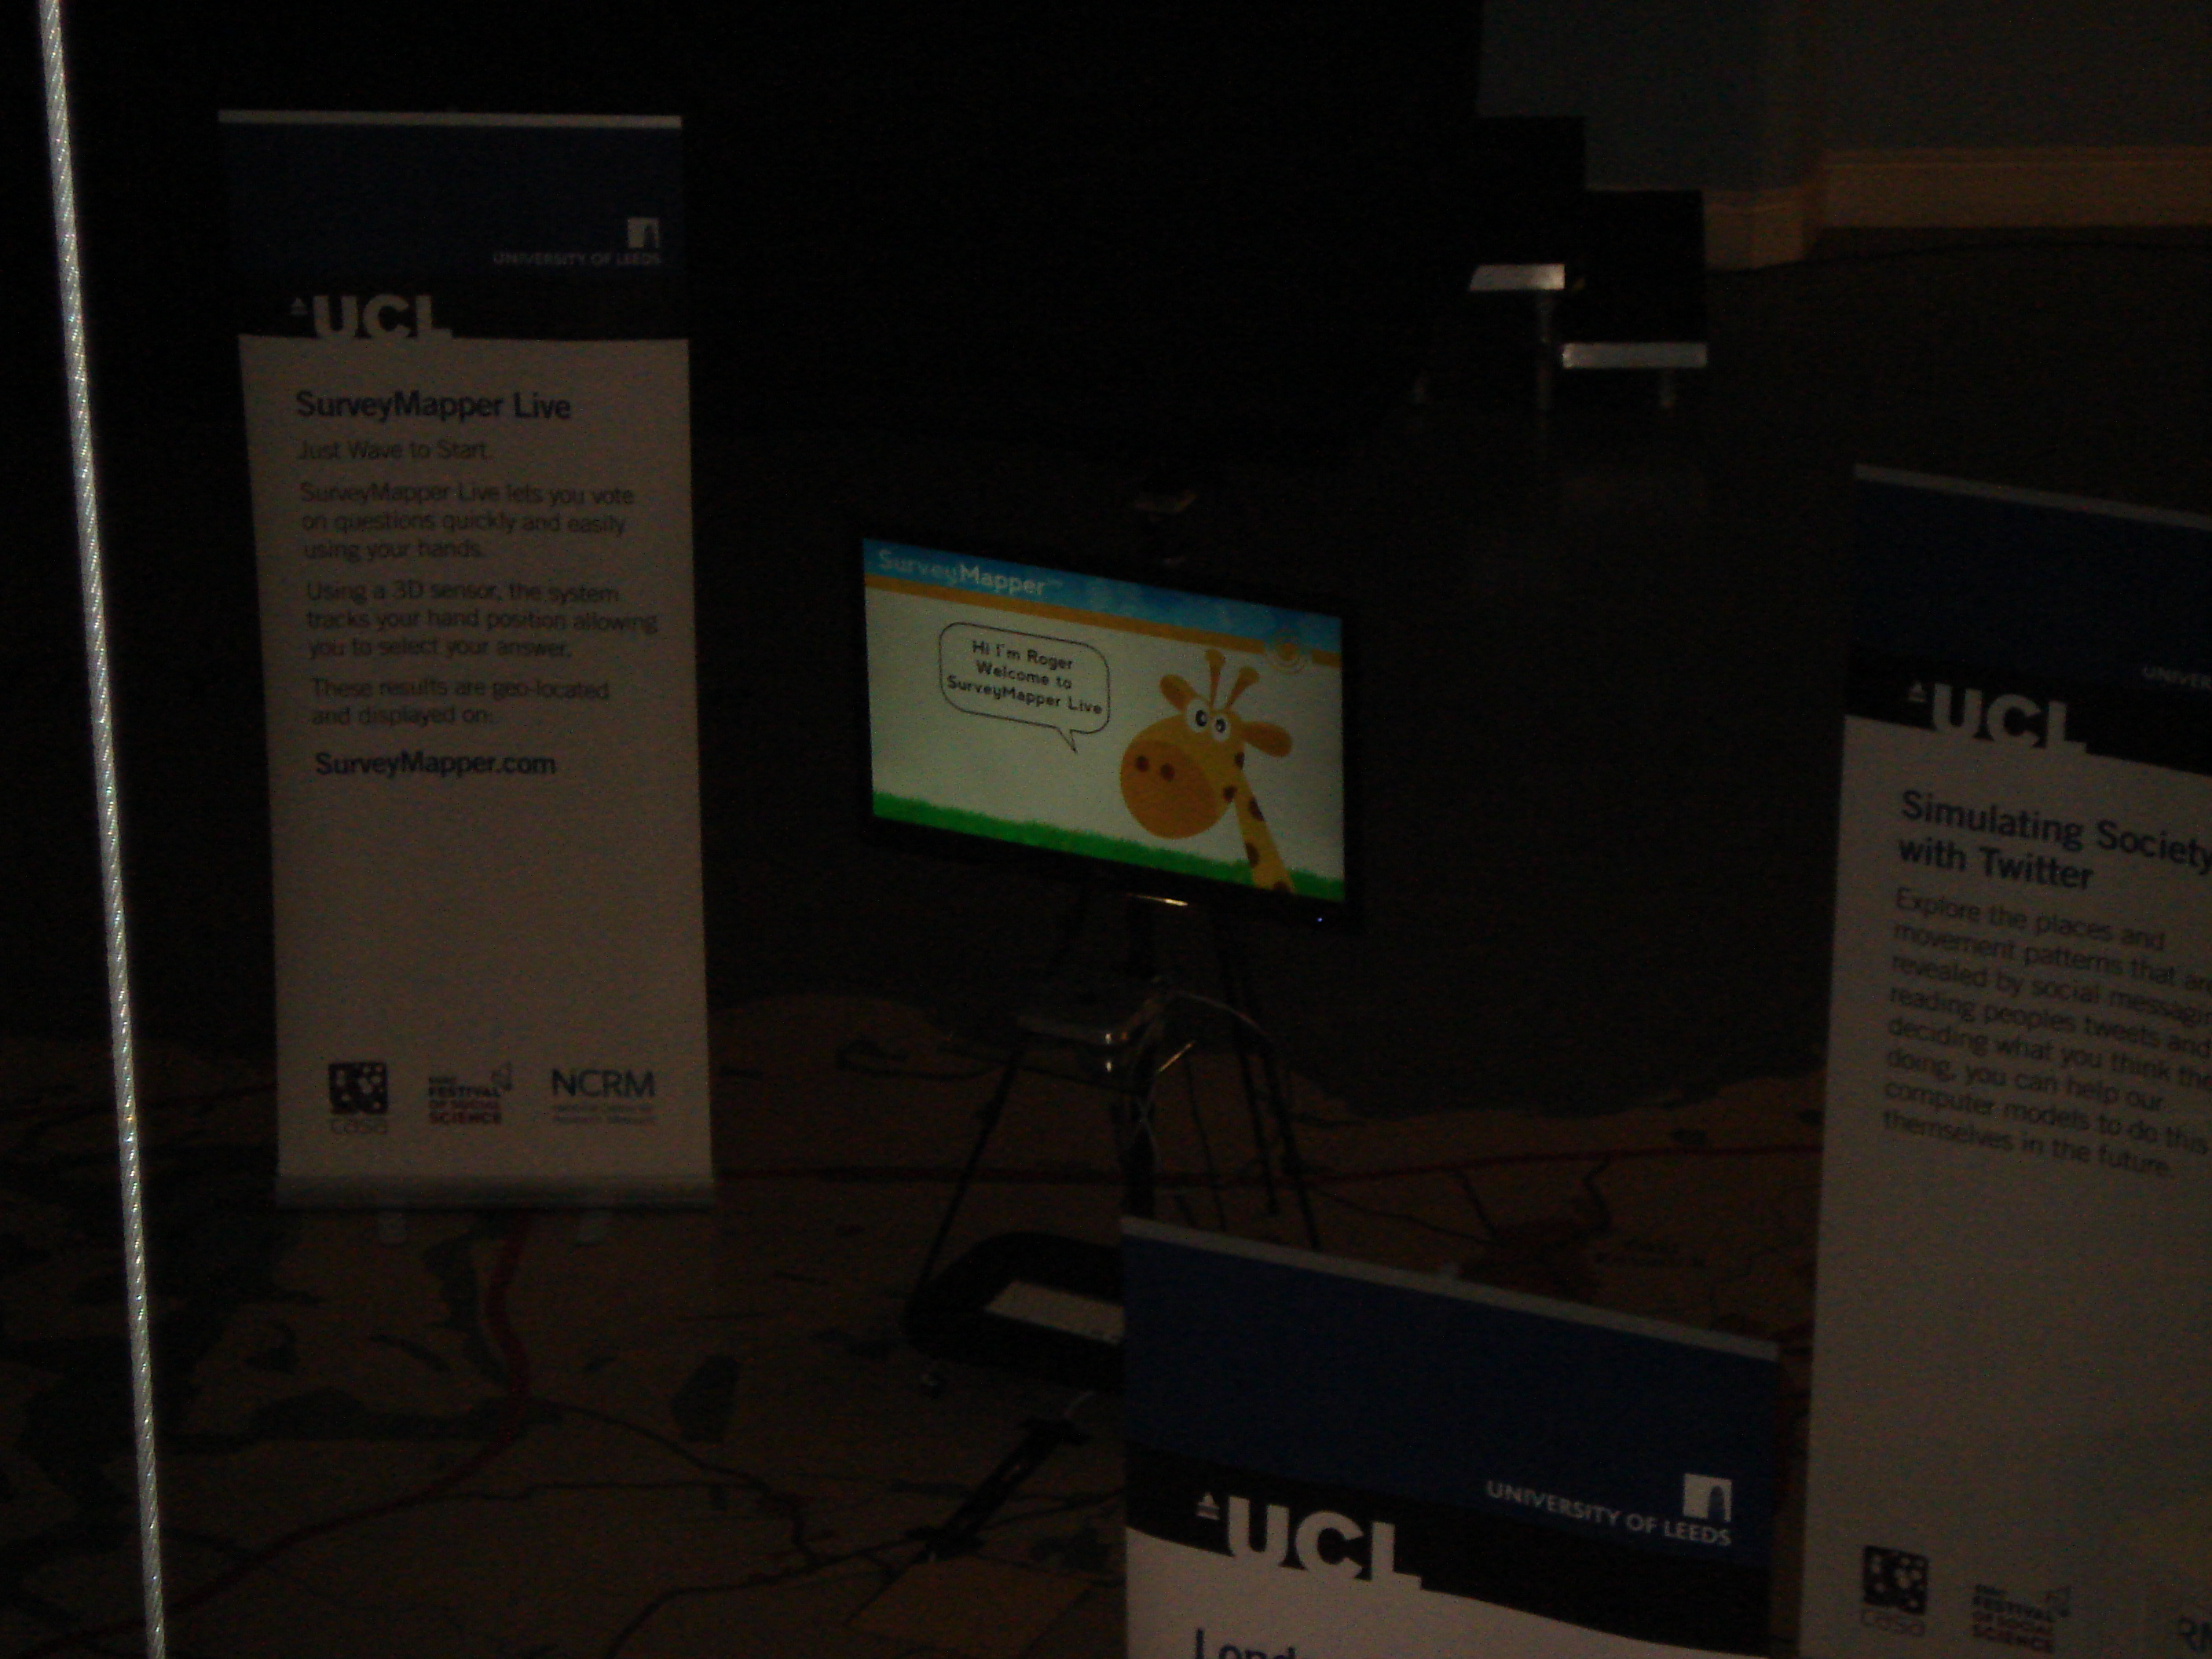
The question asked was about increased Leeds independence and over the course of the three days we received a good number of responses. The results will follow in another post once they have been analysed, but, for a first test of the system, this worked really well. The aim is to put something like this into a public space in the future.

Finally, the view from the gallery on the first floor shows the scale of the event and the size of the suspended screens.

Looking down from the gallery
Five Screens

When MonteCarlo envelopes are too narrow to show!

1% k-spatial entropy (k=3) envelopes at collocation distance 4km

Here is a pretty picture of envelopes which are overlaid each with their maximum range (including the observed curve) … to allow multiple variables to be looked at simultaneously even when the range of each curve is very different! For example in year 2011 health, social grade, and transport to work are well below their 1% envelope, so are significantly describing a spatial pattern (as measured by the k-spatial entropy) which is not happening by chance (random permutations of the spatial units). see more on the NARSC 2012 abstract/paper ” Entropic variations of urban dynamics at different spatio-temporal scales:  geocomputational perspectives” Didier G. Leibovici & Mark H. Birkin (http://www.meetingsavvy.com/abstractsearch/). Nonetheless the level of non-uniformity is very different, respectively 0.2, 0.4 and 0.1, but are all quite low compared to a maximum under uniformity of 1.

(click on the picture to see it bigger)

Hex Bug Spiders with Computer Vision

Following on from my previous post about controlling the Hex Bug spiders from a computer, I’ve added a computer vision system using a cheap web cam to allow them to be tracked. The web cam that I’m using is a Logitech C270, but mainly because it was the cheapest one in the shop (£10).

I’ve added a red cardboard marker to the top of the spider and used the OpenCV library in Java through the JavaCV port. The reason for using Java was to allow for linking to agent based modelling software like NetLogo at a later date. You can’t see the web cam in the picture because it is suspended on the aluminium pole to the left, along with the projector and a Kinect. The picture shows the Hex Bug spider combined with Martin Austwick‘s Roving Eye exhibit from the CASA Smart Cities conference in April.

The Roving Eye exhibit is a Processing sketch running on the iMac which projects ‘eyeballs’ onto the table. It uses a Kinect camera so that the eyeballs avoid any physical objects placed on the table, for example a brown paper parcel or a Hex Bug spider.

Because of time constraints I’ve used a very simple computer vision algorithm using moments to calculate the centre of red in the image (spider) and the centre of blue in the image (target). This is done by transforming the RGB image into HSV space and thresholding to get a red only image and a blue only image. Then the moments calculation is used to find the centres of the red and blue markers in camera space. In the image above you can see the laptop running the spider control software with the camera representation on the screen showing the spider and target locations.

Once the coordinates of the spider and target are known, a simple algorithm is used to make the spider home in on the blue marker. This is complicated by the fact that the orientation of the spider can’t be determined just from the image (as it’s a round dot), so I retain the track of the spider as it moves to determine its heading. The spider track and direction to target vectors are used to tell whether a left or right rotation command is required to head towards the target, but, as you can see from the following videos, the direction control is very crude.

The following videos show the system in action:


Links:

Martin Austwick’s Sociable Physics Blog: http://sociablephysics.wordpress.com/

Smart Cities Event at Leeds City Museum: http://www.geog.leeds.ac.uk/research/events/conferences/smart-cities-bridging-the-physical-digital/