
My last post on the delays caused by the snow contained a comment about a bug in the D3 library. Not wanting to just leave this, I’ve done some more testing with the latest D3 code. As can be seen from the graph below, something corrupts the x coordinate in the SVG path:
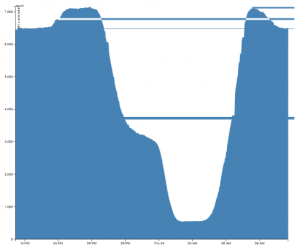
On further inspection, the horizontal lines are caused by the following anomaly in the SVG path element:
<path d=”M890,69.15851272015652………….
L774.8666471048152,5.417948001118248
L773.0392824747554,3.3994967850153444
L771.201277694171,0.6374056471903486
L-13797062.104351573,5.736650824713479
L767.5585693674684,5.736650824713479
L765.6888979556953,12.004473022085563
L763.9054848634413,12.004473022085563
L762.0744956782887,12.004473022085563
Looking at line 4, a large negative number has crept into the X coordinate list, which is giving the horizontal lines.
I’ve verified that the original data is correct, I’m using the v3 release version of D3 and exactly the same thing happens with IE9, Chrome and Firefox. This graph has 486 data values, so it’s not exactly massive.
I’ll post more once I’ve tracked the problem down.