
Having collected large amounts of data on tubes, trains and buses over the Olympics period using the ANTS library, the first thing I’ve looked at is to plot the total number of tubes running every day. The two graphs below show the number of tubes by line and the total number of tubes running for all lines.
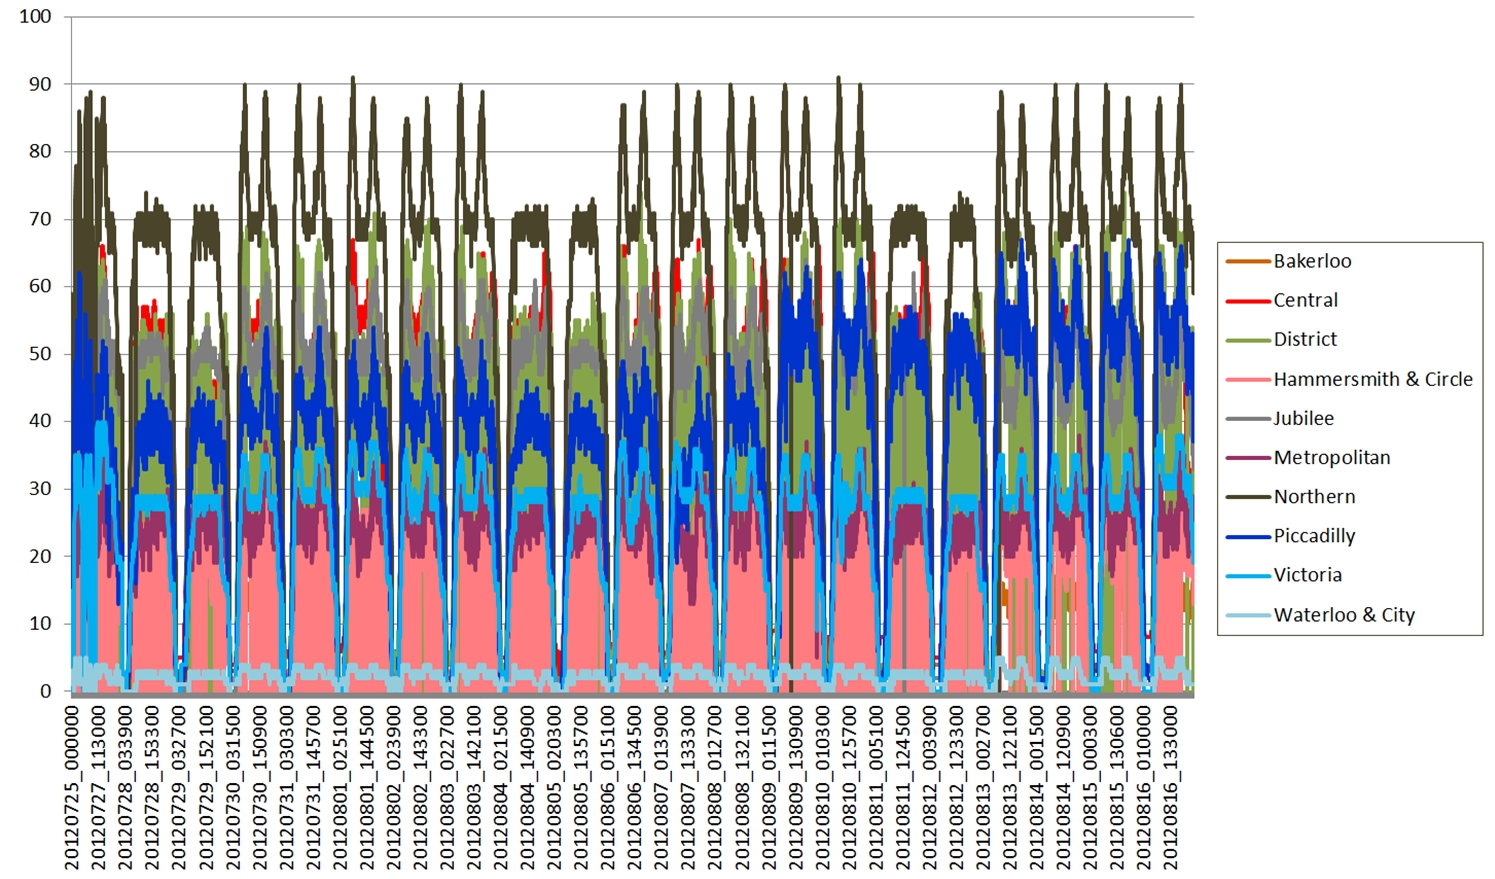
Numbers of tubes running on each line from 25 July 2012 until 16 August 2012.
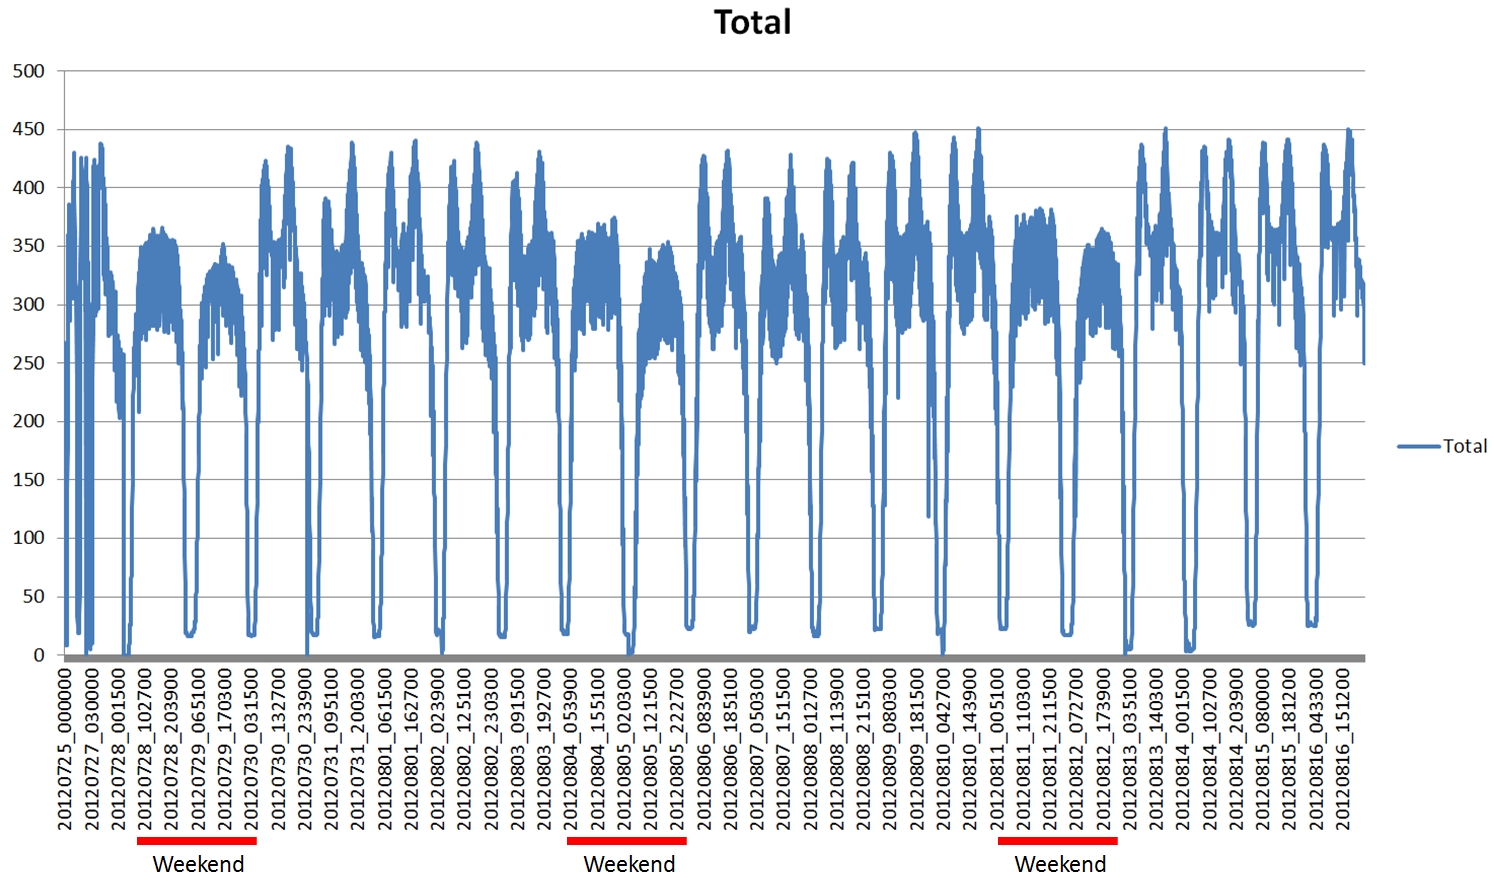
Total number of tubes running on all lines from 25 July 2012 to 16 August 2012. Weekend periods are highlighted with red bars.
Looking at this data it becomes apparent that the weekend has a very different characteristic compared to during the week. Also, there is a definite daily variation during the week with a distinct morning and evening rush hour. One interesting thing left to look at is whether the lines serving the Olympics venues show any variation before and during the Olympics period.
Why not download the free community version of Datascape and try visualizing and exploring your data in 3D?
Then enter our prize competition with your visualisation… 🙂 – http://www.daden.co.uk/data-visualisation-competition-launched-by-daden/
More details on our website.
Soulla