
The algorithms required to build virtual worlds like Google Earth and World Wind are really fascinating, but building a virtual world containing real-time city data is something that hasn’t yet been fully explored. Following on from the Smart Cities presentation in Oxford two weeks ago, I’ve taken the agent-based London Underground simulation and made some improvements to the graphics. While I’ve seen systems like Three.js, Unity and Ogre used for some very impressive 3D visualisations, what I wanted to do required a lower level API which allowed me to make some further optimisations.
Here is the London Underground simulation from the Oxford presentation:
The Oxford NCRM presentation showed the Earth tiled with a single resolution NASA Blue Marble texture, which was apparent as the view zoomed in to London to show the tube network and the screen space resolution of the texture map decreased.
The Earth texture and shape needs some additional work, which is where “level of detail” (LOD) comes in. The key point here is that most of the work is done by the shader using chunked LOD. If the Earth is represented as a spheroid using, for example 40 width segments and 40 height slices, then recursively divided using either quadtree or octtree segmentation, we can draw a more detailed Earth model as the user zooms in. By using the same number of points for each sub-mesh, only a single index buffer is needed for all LODs and no texture coordinates or normals are used. The shader uses the geodetic latitude and longitude calculated from the Cartesian coordinates passed for rendering, along with the patch min and max coordinates, to get the texture coordinates for every texture tile.

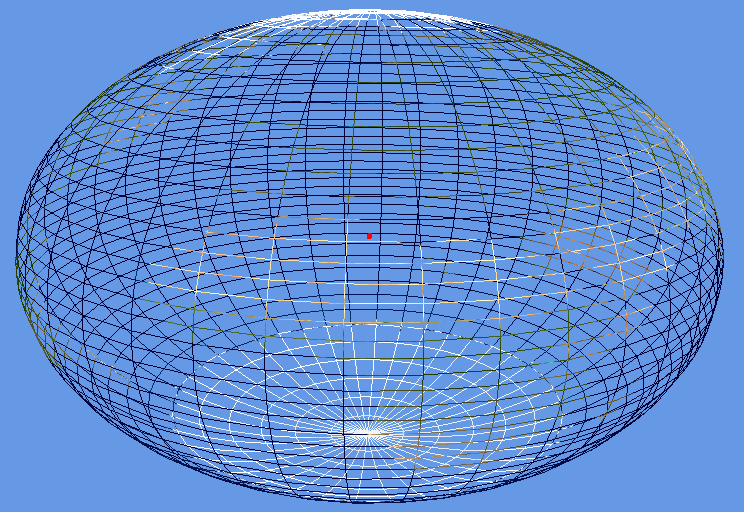
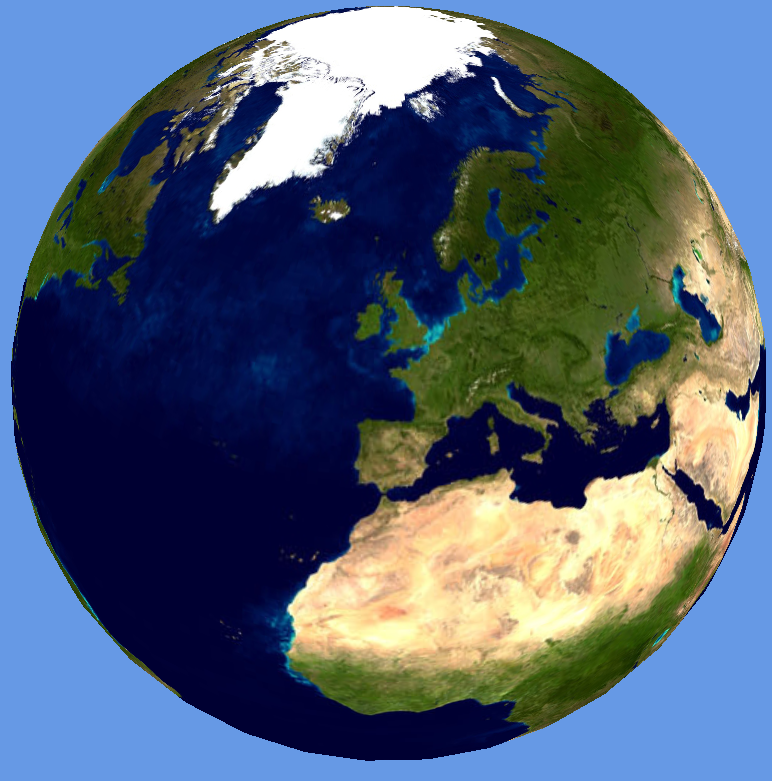
The two images above show the Earth using the the NASA Blue Marble texture. The semi-major axis has been increased by 50%, which gives the “smartie” effect and serves to show the oblateness around the equator. The main reason for doing this was to get the coordinate systems and polygon winding around the poles correct.
In order for the level of detail to work, a screen space error tolerance constant (labelled Tau) is defined. The rendering of the tiled earth now works by starting at the top level and calculating a screen space error based on the space that the patch occupies on the screen. If this is greater than Tau, then the patch is split into its higher resolution children, which are then similarly tested for screen space error recursively. Once the screen space error is within the tolerance, Tau, then the patch is rendered.
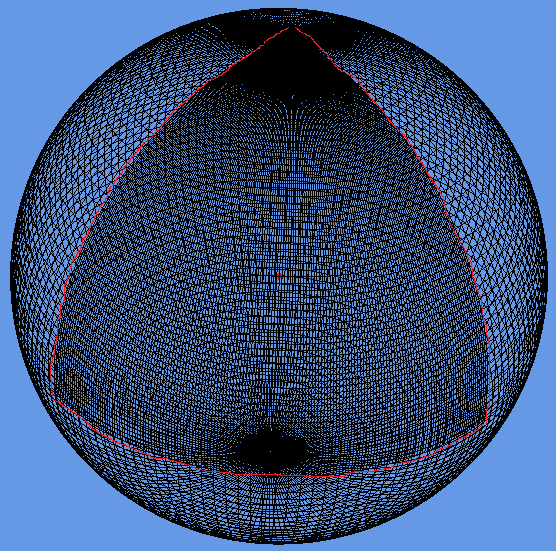
The two images above show a correct rendering of the Earth, along with the underlying mesh. The wireframe shows a triangular patch on the Earth at the closest point to the viewer which is double the resolution (highlighted with red line). Octtree segmentation has been used for the LODs.
The code has been made as flexible as possible, allowing all the screen error tolerances, mesh slicing and quad/oct tree tiling to be configured to allow for as much experimentation as possible.
The interesting thing about writing a 3D system like this is that it shows that tiling is a fundamental operation in both 2D and 3D maps. In web-based mapping, 2D, maps are cut into tiles, which are usually 256 pixels square, to avoid having to load massive images onto the web browser. In 3D, the texture sizes might be bigger, but, bearing in mind that Google are reported to be storing around 70TB of texture data for the Earth, there is still the issue of out of core rendering. For the massive terrain rendering systems, management of data being moved between GPU buffers, main memory, local disk and the Internet is the key to performance. My feeling was that I would let Google do the massive terrain rendering and high resolution textures and just concentrate on building programmable worlds that allow exploration, simulation and experimentation with real data.
Finally, here’s a quick look at something new:
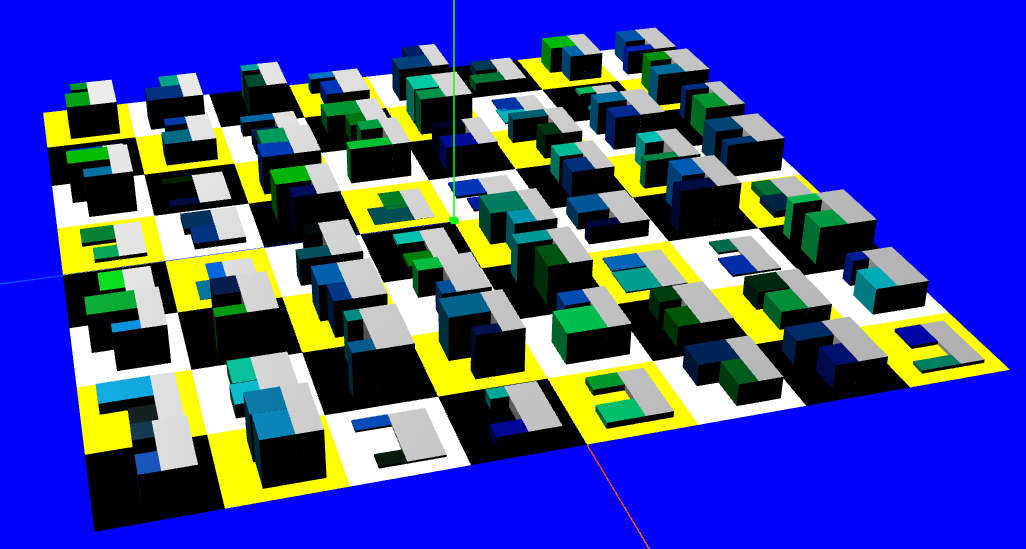
The tiled Earth mesh uses procedural generation to create the levels of detail, so, extending this idea to procedural cities, we can follow the “CGA Shape” methodology outlined in the “Procedural Modeling of Buildings” paper to create our own virtual cities.
Useful Links:
http://tulrich.com/geekstuff/chunklod.html
http://tulrich.com/geekstuff/sig-notes.pdf
http://peterwonka.net/Publications/pdfs/2006.SG.Mueller.ProceduralModelingOfBuildings.final.pdf