
As you can see from the image below, we spent three days at the NCRM Research Methods Festival in Oxford (#RMF14) last week.
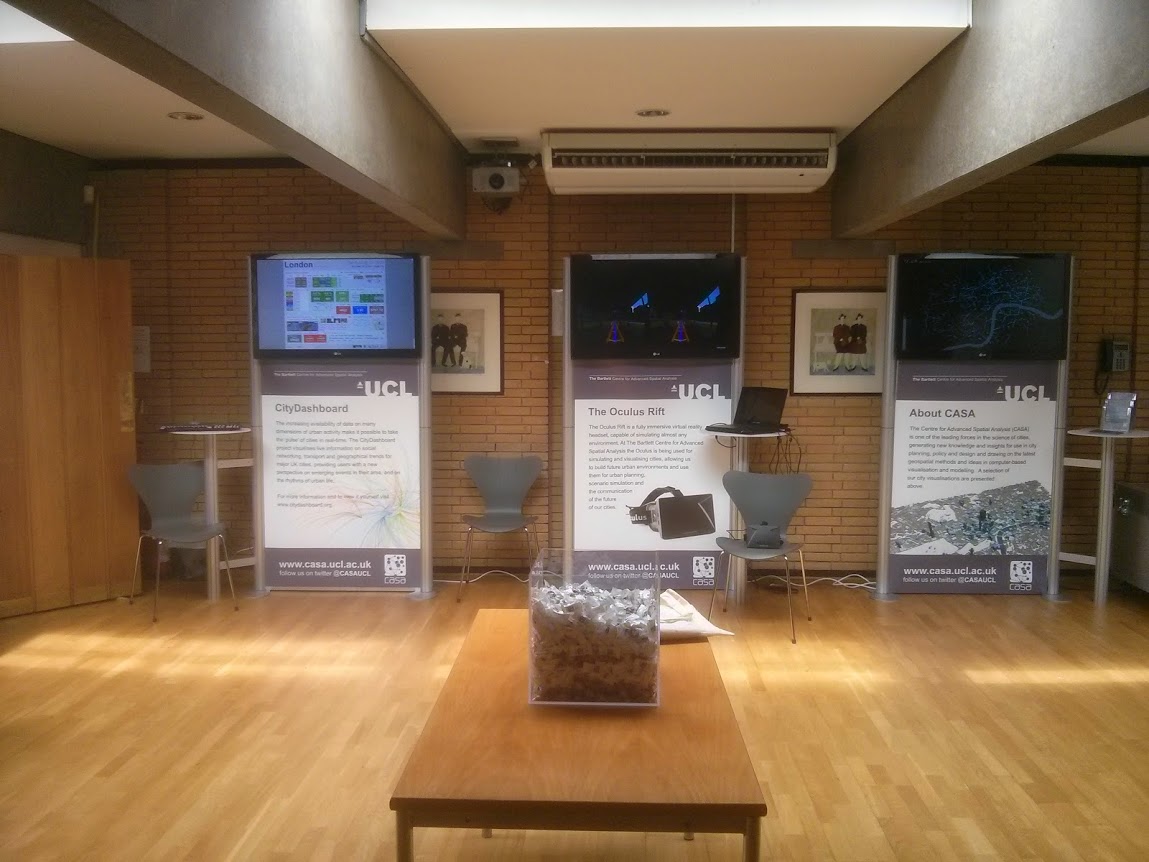
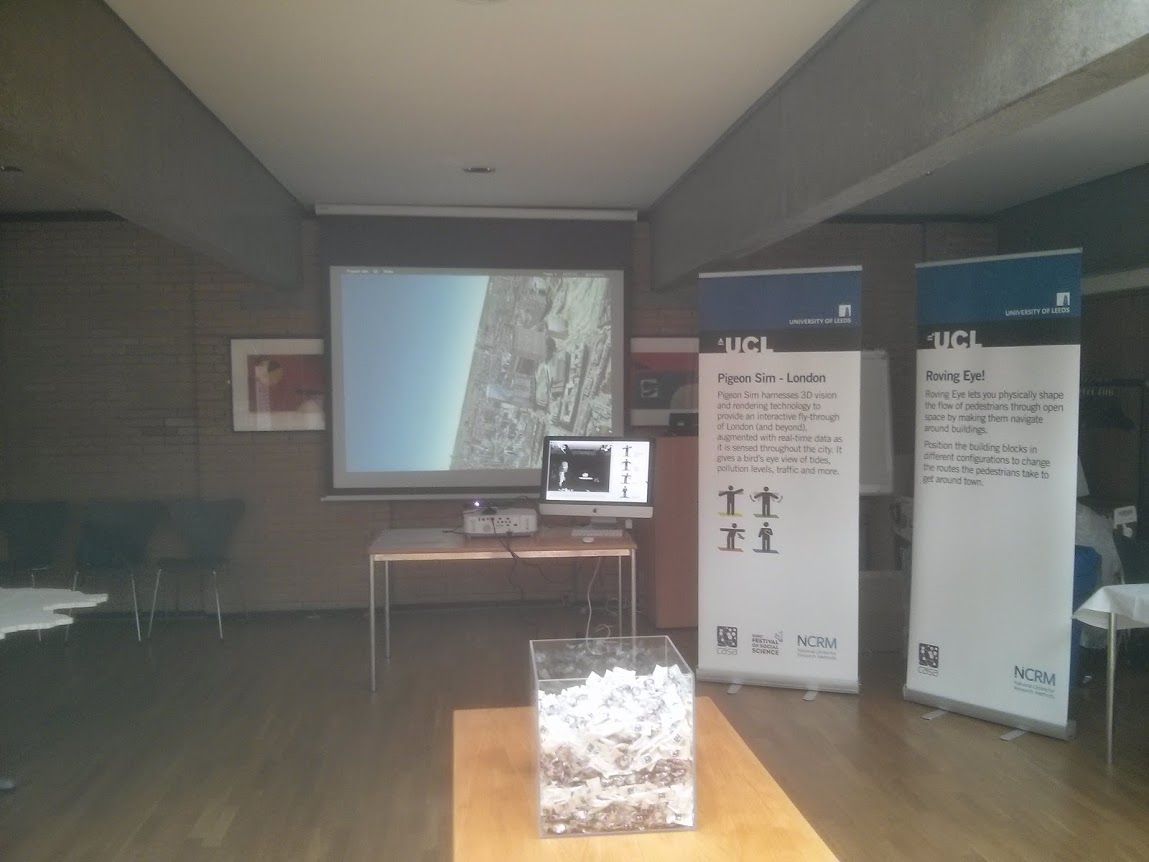
In addition to our presentations in the “Researching the City” session on the Wednesday morning, we were also running a Smart Cities exhibition throughout the festival showcasing how the research has been used to create live visualisations of a city. This included the now famous “Pigeon Simulator”, which allows people to fly around London and is always very popular. The “About CASA” screen on the right of the picture above showed a continuous movie loop of some of CASA’s work.
The exhibition was certainly very busy during the coffee breaks and, as always at these types of events, we had some very interesting conversations with people about the exhibits. One discussion with a lawyer about issues around anonymisation of Big Datasets and how you can’t do it in practice made me think about the huge amount of information that we have access to and what we can do with it. Also, the Oculus Rift 3D headset was very popular and over the three days we answered a lot of questions from psychology researchers about the kinds of experiments you could do with this type of device. The interesting thing is that people trying out the Oculus Rift for the first time tended to fall into one of three categories: can’t see the 3D at all, see 3D but with limited effect, or very vivid 3D experience with loss of balance. Personally, I think it’s part psychology and part eye-sight.
Next time I must remember to take pictures when there are people around, but the sweets box got down to 2 inches from the bottom, so it seems to have been quite popular.
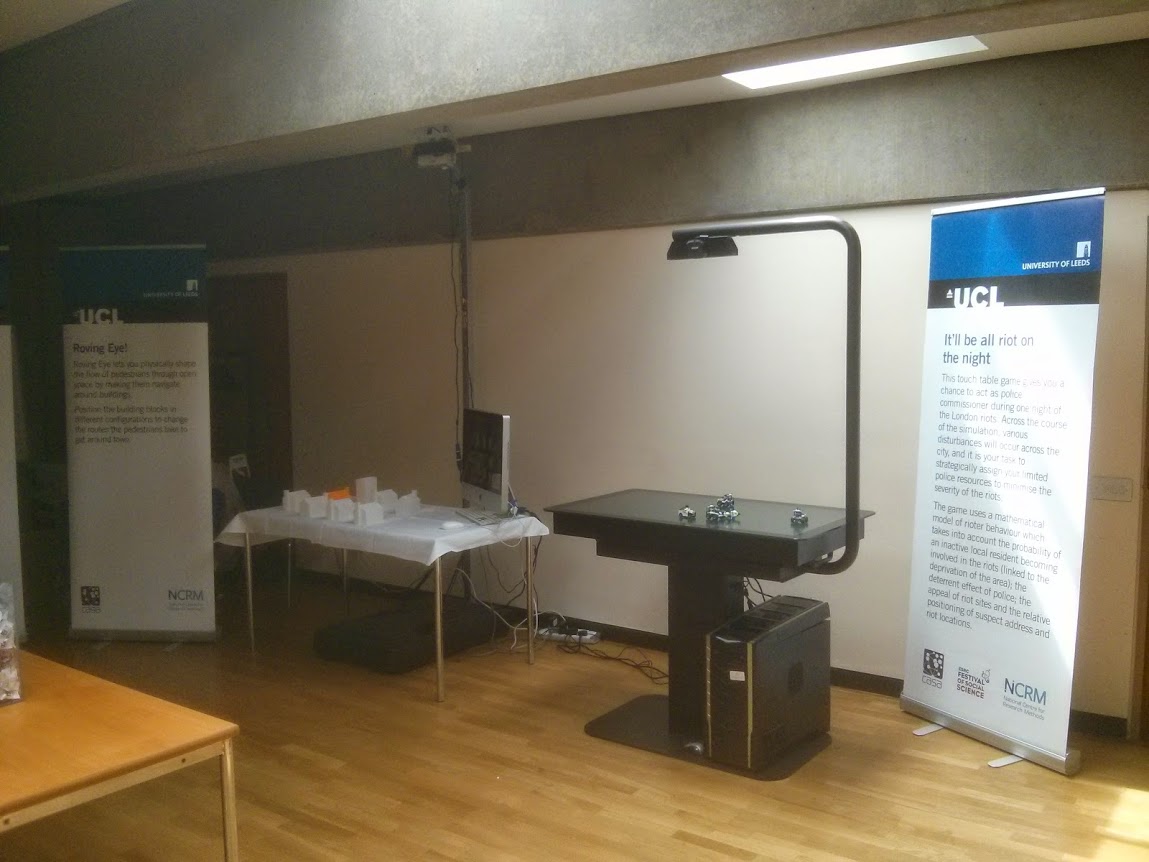
We had to get new Lego police cars for the London Riots Table (right), but the tactile nature of the Roving Eye exhibit (white table on the left) never fails to be popular. I’ve lost count of how many hours I’ve spent demonstrating this, but people always seem to go from “this is rubbish, pedestrians don’t behave like that”, through to “OK, now I get it, that’s really quite good”. The 3D printed houses also add an element of urban planning that wasn’t there when we used boxes wrapped in brown paper.

The iPad wall is shown on the left here with the London Data Table on the right. Both show a mix of real-time visualisation and archive animations. The “Bombs dropped during the Blitz” visualisation on the London Data Table which was created by Kate Jones (http://bombsight.org ) was very popular, as was the London Riots movie by Martin Austwick.
All in all, I think we had a fairly good footfall despite the sunshine, live Jazz band and wine reception.