
The Census 2011 boundary files for the OA, LSOA and MSOA geographies have just been added to the MapTube tile server, so it’s now possible to make maps from the new Census data. The following is the first example using the population density table:
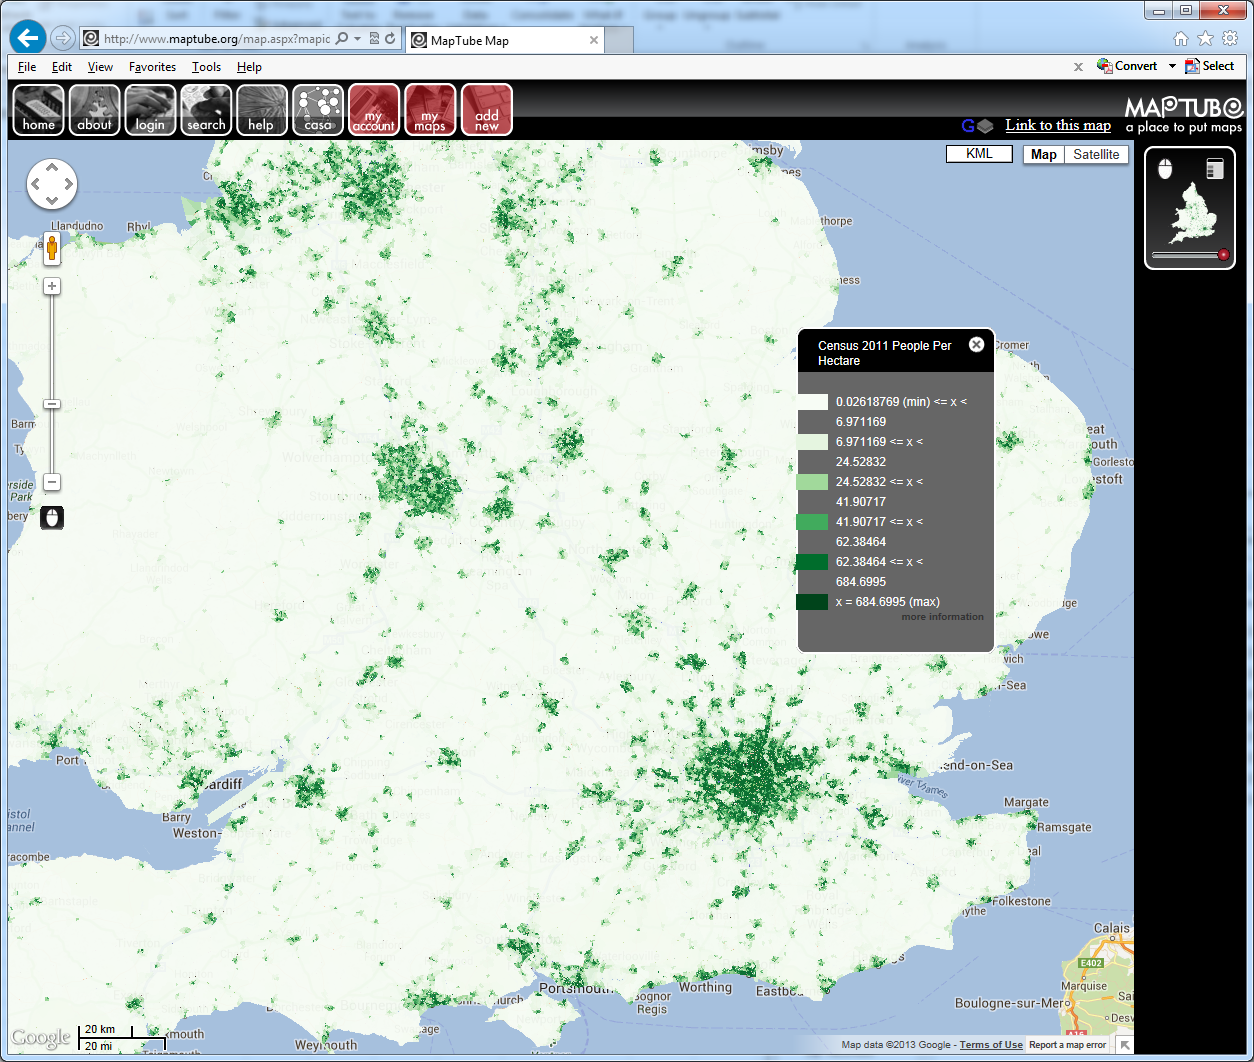
MapTube showing population density (people per hectare) from the 2011 Census at LSOA level.
The live map is accessible at the following link: http://www.maptube.org/map.aspx?mapid=1277
The data was uploaded as a CSV file from the NOMIS r2.2 bulk download. As long as there is a CSV file containing a header row, plus a recognisable column containing an area key, MapTube should be able to work out what the file contains and build the map automatically.
Now that the new boundary files are on the live server, it is possible to upload the entire Census release as an automatic process using the DataStore handling code mentioned in previous posts. While this might seem like a good idea, from previous experience, quality is more important than quantity. Using the DataStore mining process to find interesting and unusual data and uploading that instead would seem like the better option.