The idea of cities mirroring computer operating systems has been around for a while (see: http://teamhelsinki.blogspot.co.uk/2007/03/city-as-operating-system.html ), but recent events have made me wonder whether this might be about to become more important. Cities are systems in exactly the same way that complex computer systems are, although how cities function is a black box. Despite that difference, computer systems are now so big and complex that understanding how the whole system works is incomprehensible and we rely on monitoring, which is how we come back to the city systems. Recently, we had a hardware failure on a virtual machine host, but in this case I happened to be looking at the Trackernet real-time display of the number of tubes in London. This alerted me to the fact that something was wrong, so I then switched to the virtual machine monitoring console and diagnosed the failure. We were actually out of the office at the time, so the publicly accessible tube display was easier to access than the locked down secure console for the hardware. The parallels between the real-time monitoring of a server cluster and real-time monitoring of a city system are impossible to ignore. Consider the screenshot below:
Screenshot from an iPad showing a stream graph of the number of tubes running in London on Friday 22nd and Saturday 23rd March 2013.
We could very easily be looking at CPU load, disk or network bandwidth for a server, but it happens to be the number of tubes running on the London Underground. Points 1 and 2 show a problem on the tube network around 3PM on Friday. It’s not very easy to tell from this visualisation, but the problem is on the Piccadilly line and then the Jubilee line. However, the purpose of this display is to alert the user to any problems which they can then diagnose further. Point 3 is not so easy to detect, but the straight lines suggest missing data. Going back to the original files, everything appears normal and all data is being logged, so this could be an API or other network failure that rectified itself. Point 4 is similar, but this can be explained as a Saturday morning outage for maintenance to prevent the problem that we saw on Wednesday happening again.
It is this symbiotic relationship between the real-time monitoring of city systems and computer systems that is really interesting. We are logging a lot more data than is shown on this graph, so the key is to work out what factors we need to be looking at to understand what is really happening. Add a spatial element to this and the system suddenly becomes a whole lot more complicated.
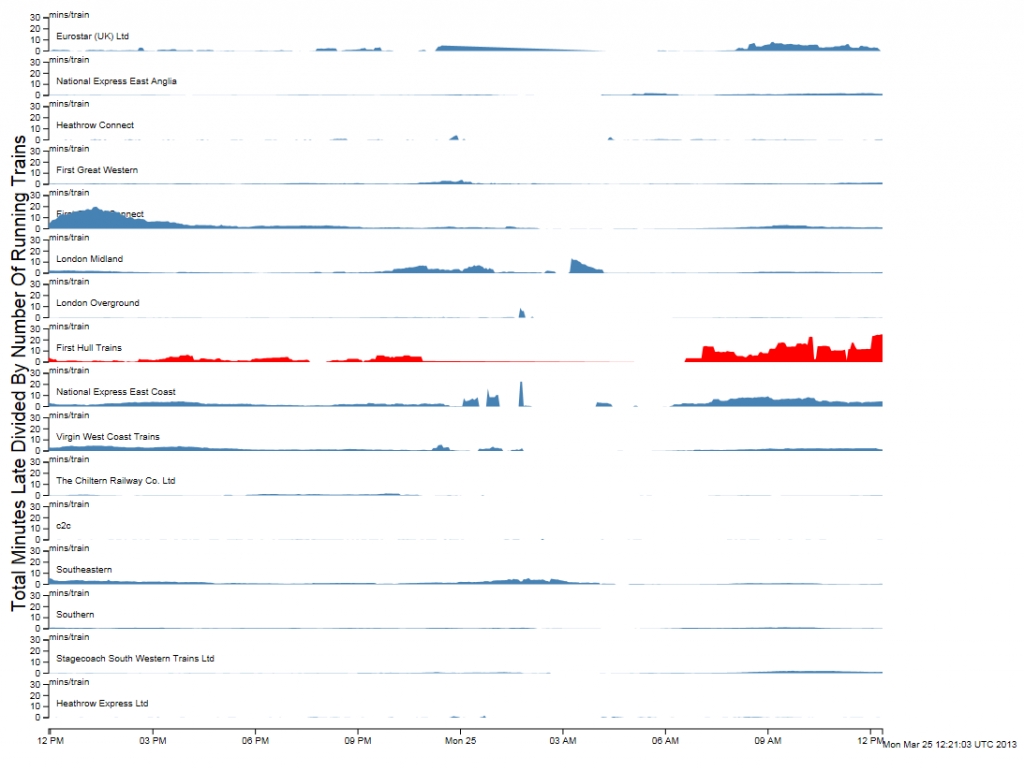
To finish off with, here is view of the rail network at 12pm on 25 March 2013 (another snow day in the North of the country). The similarity between this view and and a seismograph is apparent, but what is being plotted is average minutes late per train. The result is very similar to a CPU or disk activity graph on a server, but minute by minute we’re watching trains running.
Links
http://teamhelsinki.blogspot.co.uk/2007/03/city-as-operating-system.html
http://www.smartplanet.com/blog/smart-takes/london-tests-out-smart-city-operating-system/26266

