
We had the first snow of the Winter in London this morning, around 07:30 and lasting no more than half an hour. I’ve been building the data layer for the iPad video wall, so switched the National Rail data collection on once I got to work around 09:50. The idea was to collect data to measure how the rail system recovered from its early morning shock. The results are shown below:
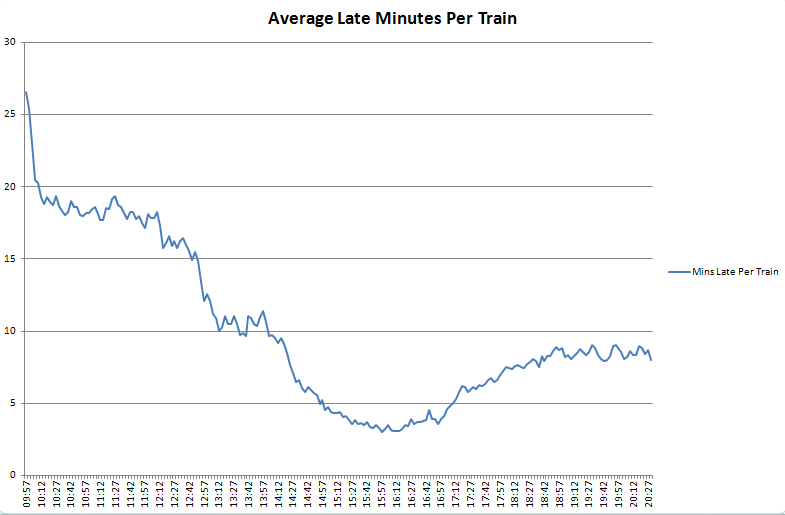
The graph shows a plot of the number of minutes late for every train running, divided by the total number of trains. In other words, the average number of late minutes per train. It’s evident from the graph that trains initially started out over 30 minutes late, then dropped to 20 and then to 10 minutes late, before reaching a minimum around 4pm in the afternoon. Then the rush hour starts to kick in again and the additional load causes the average late time to creep up again. The official line on the way home was, “due to adverse weather conditions…”.
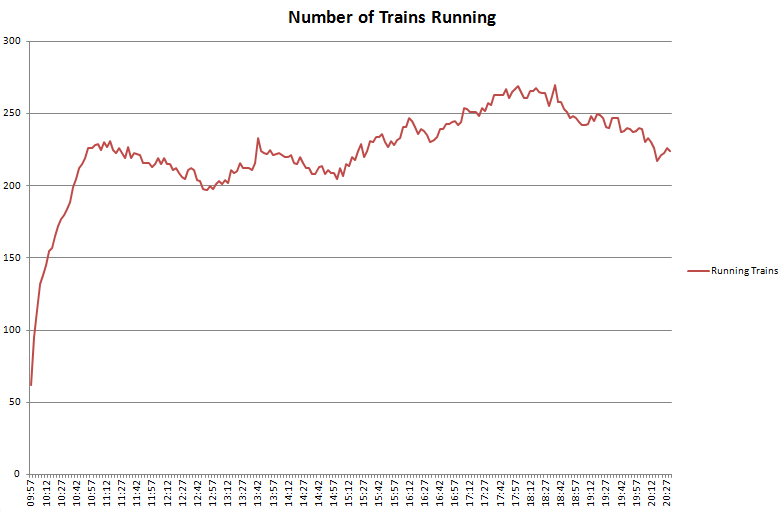
The second graph shows the total number of trains running throughout the day. The data collection system was switched on at around 09:57 and it appears to take about an hour before the number of running trains approaches normal levels.
The aim of this work is to collect as much data about the city as possible, which will allow us to mine the information for significant events. This includes all tube, bus and heavy rail movements, weather and air quality, plus any other data we can obtain in the areas of finance, hydrology, population or telecommunications.