
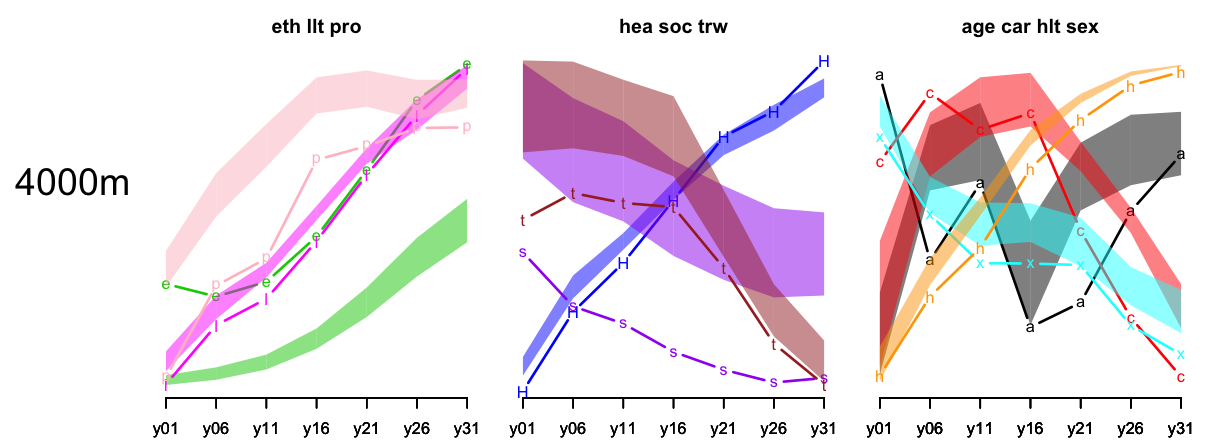
Here is a pretty picture of envelopes which are overlaid each with their maximum range (including the observed curve) … to allow multiple variables to be looked at simultaneously even when the range of each curve is very different! For example in year 2011 health, social grade, and transport to work are well below their 1% envelope, so are significantly describing a spatial pattern (as measured by the k-spatial entropy) which is not happening by chance (random permutations of the spatial units). see more on the NARSC 2012 abstract/paper ” Entropic variations of urban dynamics at different spatio-temporal scales: geocomputational perspectives” Didier G. Leibovici & Mark H. Birkin (http://www.meetingsavvy.com/abstractsearch/). Nonetheless the level of non-uniformity is very different, respectively 0.2, 0.4 and 0.1, but are all quite low compared to a maximum under uniformity of 1.
(click on the picture to see it bigger)